Cantonment: Fire Incidents, Florida (FL)
Where are fire incidents reported in Cantonment, FL
Something went wrong! Please refresh the page.
|
| |||||||||||||||||||||||||||||||||||||||||||||||||||||||||||||||||||||||||||||||||||||||||||||||||||||||||||||
2003 - 2018 National Fire Incident Reporting System (NFIRS) incidents
- Incident types reported to NFIRS in Cantonment, FL
- 3,38453.4%Rescue & EMS
- 94214.9%Fire
- 63410.0%Service Call
- 6109.6%Good Intent Call
- 4026.3%Hazardous Condition
- 3515.5%False Alarm
- 110.2%Severe Weather
- 70.1%Overpressure Rupture
- Fire incident types reported to NFIRS in Cantonment, FL
- 49152.1%Outside Fires
- 25226.8%Structure Fires
- 12313.1%Mobile Property/Vehicle Fires
- 768.1%Other
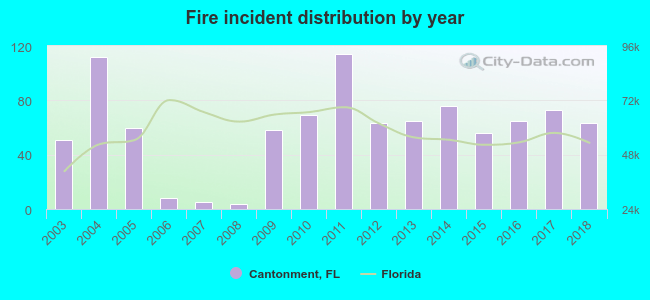 Based on the data from the years 2003 - 2018 the average number of fires per year is 59. The highest number of fires - 114 took place in 2011, and the least - 4 in 2008. The data has a growing trend.
The average number of yearly fire incidents per 10k residents in Cantonment, FL compared to nearest cities:
(Note: Based on data for the last 3 years, including only cities with population 5,000 and above)
| Cantonment: | 14.9 |
| Brent: | 0.5 |
| Pace: | 72.2 |
| West Pensacola: | 0.5 |
| Pensacola: | 189.1 |
| Milton: | 364.9 |
| Gulf Breeze: | 138.8 |
| East Milton: | 21.7 |
| Navarre: | 34.4 |
 The median response time based on all reported fire incidents is 8 minutes. This is higher than the state median value.
The median response time in Cantonment, FL compared to nearest cities:
(Note: Based on data for all years, including only cities with at least 500 fire incidents)
| Cantonment: | 8 minutes |
| Pace: | 8 minutes |
| Pensacola: | 6 minutes |
| Milton: | 8 minutes |
| Gulf Breeze: | 7 minutes |
| Orange Beach: | 5 minutes |
| Foley: | 7 minutes |
| Navarre: | 7 minutes |
| Gulf Shores: | 5 minutes |
 27.7% incidents where reported in the morning and 72.3% in the evening. The most fires (16.8%) took place on Saturday, and the least (12.5%) on Thursday.
 According to the 942 fire incident reports from years 2003 - 2018 most fires (11.3%) took place during October, and the least (5.5%) in August.
 Out of all 6,342 cases reported during the years 2003 - 2018, the most belonged to the categories: Rescue & EMS (53.4%), Fire (14.9%), and Service Call (10.0%).
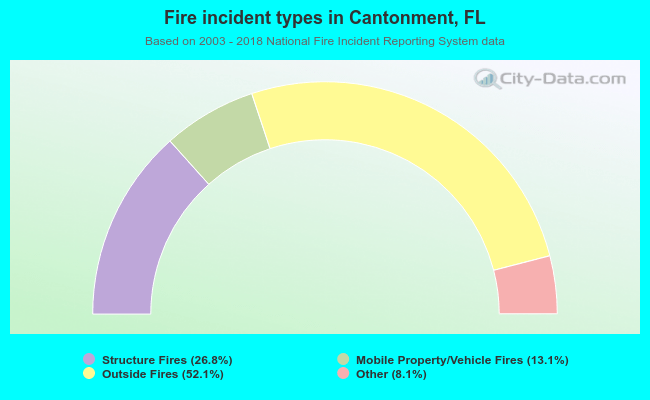 When looking into fire subcategories, the most reports belonged to: Outside Fires (52.1%), and Structure Fires (26.8%).