Cape Girardeau: Fire Incidents, Missouri (MO)
Where are fire incidents reported in Cape Girardeau, MO
Something went wrong! Please refresh the page.
| Fire incidents reported | |
|---|---|
| Sreet name | Count |
| SPRIGG ST | 140 |
| KINGSHIGHWAY HWY | 108 |
| WILLIAM ST | 96 |
| ELLIS ST | 62 |
| BENTON ST | 60 |
| FREDERICK ST | 60 |
| WEST END BLVD | 60 |
| BROADWAY | 58 |
| SPANISH ST | 56 |
| THEMIS ST | 56 |
| PACIFIC ST | 54 |
| HANOVER ST | 52 |
| MIDDLE ST | 48 |
| FOUNTAIN ST | 46 |
| BLOOMFIELD RD | 44 |
| CAPE ROCK DR | 44 |
| KINGSHIGHWAY | 44 |
| JEFFERSON AVE | 40 |
| PERRYVILLE RD | 36 |
| INDEPENDENCE ST | 34 |
| STATE HWY 177 | 34 |
| WHITENER ST | 32 |
| I-55 | 30 |
| HENDERSON AVE | 28 |
| LORIMIER ST | 28 |
| BELLEVUE ST | 26 |
| GOOD HOPE ST | 26 |
| INTERSTATE | 26 |
| MORGAN OAK ST | 26 |
| BLOOMFIELD ST | 24 |
| Other | 655 |
2002 - 2018 National Fire Incident Reporting System (NFIRS) incidents
- Incident types reported to NFIRS in Cape Girardeau, MO
- 9,89655.0%Rescue & EMS
- 2,13311.8%Fire
- 1,7519.7%Hazardous Condition
- 1,6829.3%False Alarm
- 1,2947.2%Service Call
- 1,0886.0%Good Intent Call
- 1160.6%Special Incident
- 260.1%Severe Weather
- 200.1%Overpressure Rupture
- Fire incident types reported to NFIRS in Cape Girardeau, MO
- 93944.0%Outside Fires
- 68732.2%Structure Fires
- 35216.5%Mobile Property/Vehicle Fires
- 1557.3%Other
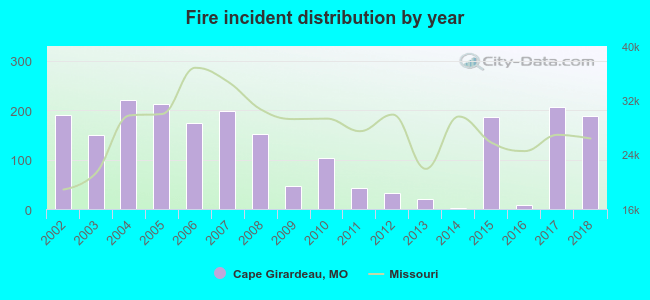 According to the data from the years 2002 - 2018 the average number of fires per year is 125. The highest number of fire incidents - 220 took place in 2004, and the least - 2 in 2014. The data has a decreasing trend.
The average number of yearly fire incidents per 10k residents in Cape Girardeau, MO compared to nearest cities:
(Note: Based on data for the last 3 years, including only cities with population 5,000 and above)
| Cape Girardeau: | 34.3 |
| Jackson: | 61.8 |
| Charleston: | 9.6 |
| Sikeston: | 104.9 |
| Perryville: | 31.0 |
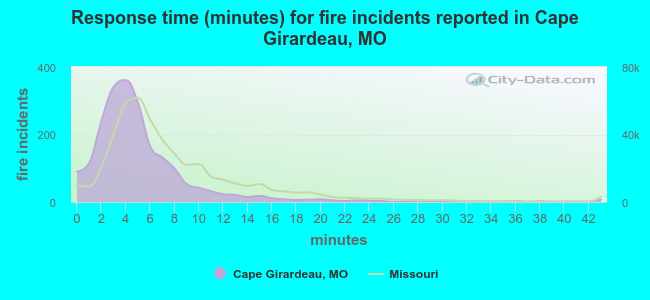 The median response time based on all reported fire incidents is 4 minutes. This is lower than the Missouri median value.
The median response time in Cape Girardeau, MO compared to nearest cities:
(Note: Based on data for all years, including only cities with at least 500 fire incidents)
| Cape Girardeau: | 4 minutes |
| Jackson: | 6 minutes |
| Anna: | 5 minutes |
| Cairo: | 3 minutes |
| Sikeston: | 5 minutes |
| Murphysboro: | 5 minutes |
| Perryville: | 10 minutes |
| Carbondale: | 4 minutes |
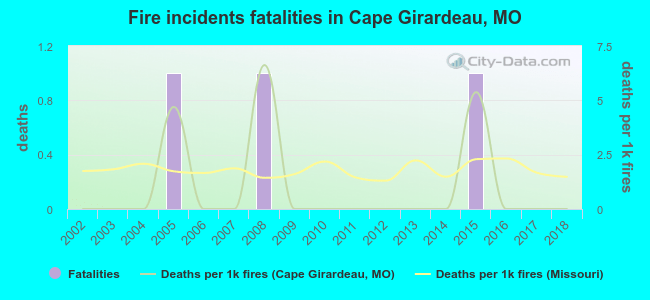 Based on the data from the years 2002 - 2018 the average number of fire-related fatalities per year is 0. The highest number of reported deaths - 1 took place in 2005, and the lowest - 0 in 2002. The data has a constant trend.
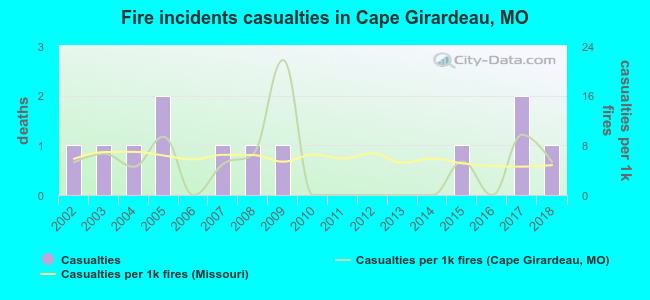 According to the data from the years 2002 - 2018 the average number of fire-related casualties per year is 1. The highest number of casualties - 2 took place in 2005, and the lowest - 0 in 2006. The data has a constant trend.
The average number of injuries per 1,000 fires is 5. This indicator was the highest - 22 in 2009, and the lowest 0 in 2006. The trend for injuries per 1,000 incidents is growing. Compared to the state value the number of casualties per 1,000 fires is about the same.
According to the data from the years 2002 - 2018 the average number of fire-related casualties per year is 1. The highest number of casualties - 2 took place in 2005, and the lowest - 0 in 2006. The data has a constant trend.
The average number of injuries per 1,000 fires is 5. This indicator was the highest - 22 in 2009, and the lowest 0 in 2006. The trend for injuries per 1,000 incidents is growing. Compared to the state value the number of casualties per 1,000 fires is about the same.Casualties per 1,000 incidents in Cape Girardeau, MO compared to nearest cities:
(Note: Based on data for all years, including only cities with at least 500 fire incidents)
| Cape Girardeau: | 5.6 |
| Jackson: | 20.1 |
| Anna: | 3.6 |
| Cairo: | 0.0 |
| Sikeston: | 11.2 |
| Murphysboro: | 15.5 |
| Perryville: | 0.0 |
| Carbondale: | 24.0 |
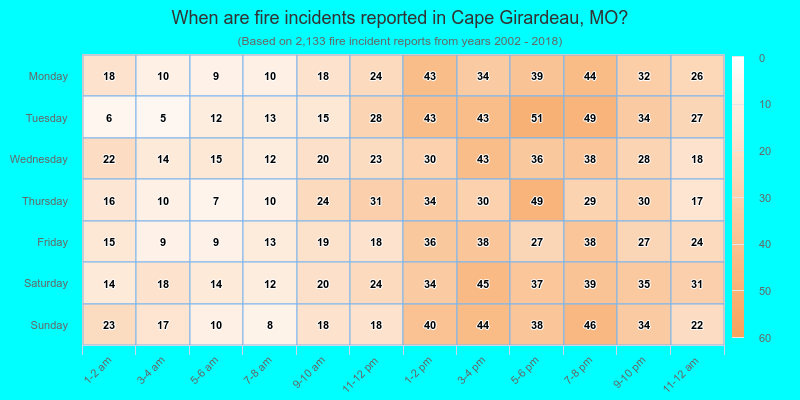
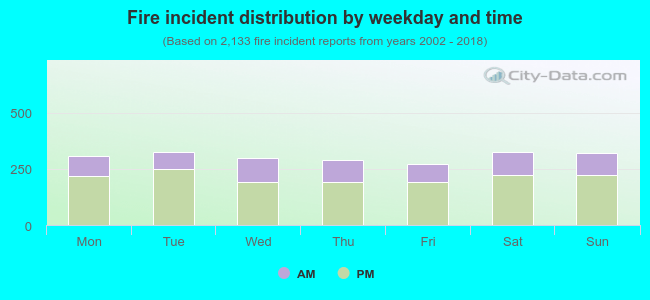 30.5% incidents where reported in the morning and 69.5% in the evening. The most fires (15.3%) took place on Tuesday, and the least (12.8%) on Friday.
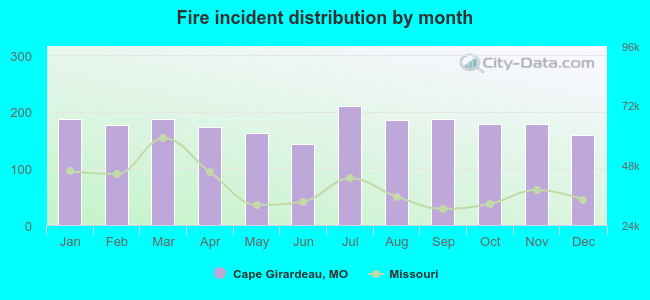 Based on the 2,133 fire incident reports from years 2002 - 2018 most fires (9.9%) took place during July, and the least (6.8%) in June.
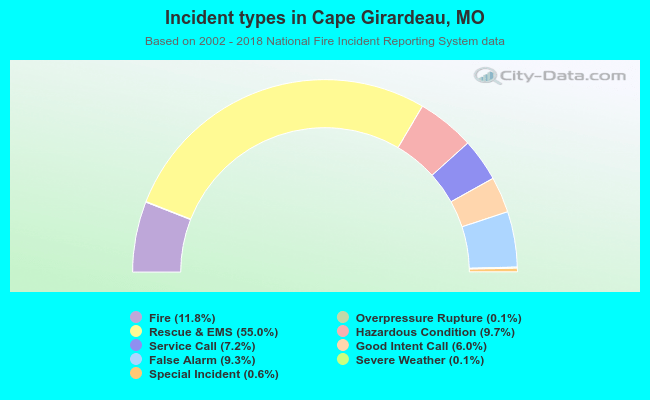 Out of all 18,006 cases reported during the years 2002 - 2018, the most belonged to the categories: Rescue & EMS (55.0%), Fire (11.8%), and Hazardous Condition (9.7%).
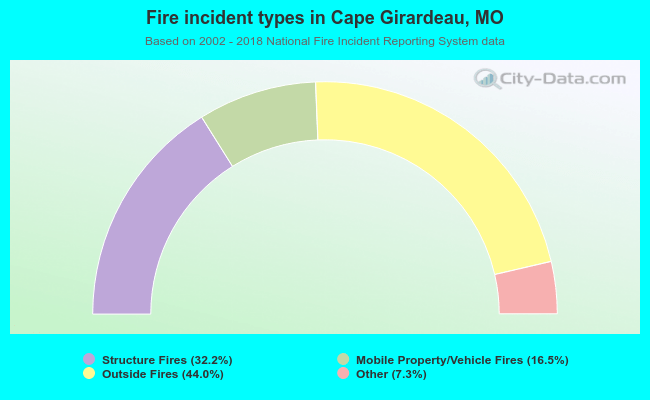 When looking into fire subcategories, the most reports belonged to: Outside Fires (44.0%), and Structure Fires (32.2%).