Cardington: Fire Incidents, Ohio (OH)
Where are fire incidents reported in Cardington, OH
Something went wrong! Please refresh the page.
|
| |||||||||||||||||||||||||||||||||||||||||||||||||||||||||||||||||||||||||||||||||||||||||||||||||||||||||||||
2002 - 2018 National Fire Incident Reporting System (NFIRS) incidents
- Incident types reported to NFIRS in Cardington, OH
- 74834.2%Fire
- 53824.6%Rescue & EMS
- 37117.0%Hazardous Condition
- 34015.5%Good Intent Call
- 1105.0%Service Call
- 693.2%False Alarm
- 70.3%Severe Weather
- Fire incident types reported to NFIRS in Cardington, OH
- 43257.8%Structure Fires
- 18925.3%Outside Fires
- 12016.0%Mobile Property/Vehicle Fires
- 70.9%Other
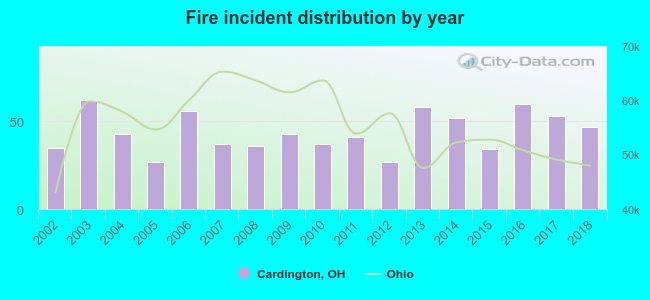 Based on the data from the years 2002 - 2018 the average number of fire incidents per year is 44. The highest number of fire incidents - 62 took place in 2003, and the least - 27 in 2005. The data has a growing trend.
 The median response time based on all reported fire incidents is 9 minutes. This is higher compared to the state median value.
The median response time in Cardington, OH compared to nearest cities:
(Note: Based on data for all years, including only cities with at least 500 fire incidents)
| Cardington: | 9 minutes |
| Ashley: | 9 minutes |
| Marengo: | 13 minutes |
| Caledonia: | 8 minutes |
| Marion: | 6 minutes |
| Delaware: | 7 minutes |
| Centerburg: | 9 minutes |
| Galion: | 6 minutes |
| Sunbury: | 9 minutes |
 31.7% incidents where reported in the morning and 68.3% in the evening. The most fires (16.7%) took place on Saturday, and the least (13.1%) on Friday.
 According to the 748 fire incidents from years 2002 - 2018 most fires (9.6%) took place during November, and the least (5.6%) in September.
 Out of all 2,187 cases reported during the years 2002 - 2018, the most belonged to the categories: Fire (34.2%), Rescue & EMS (24.6%), and Hazardous Condition (17.0%).
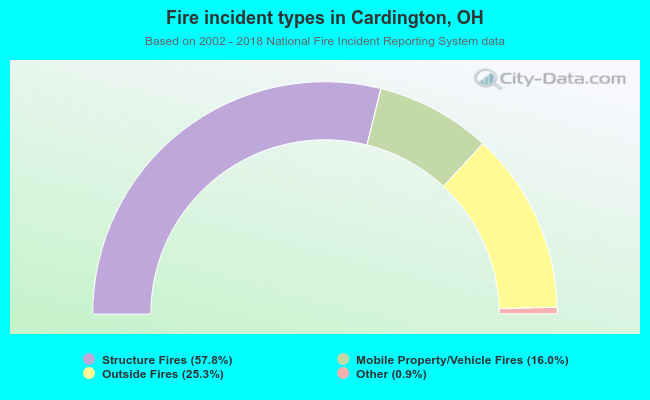 When looking into fire subcategories, the most reports belonged to: Structure Fires (57.8%), and Outside Fires (25.3%).