Carlstadt: Fire Incidents, New Jersey (NJ)
Where are fire incidents reported in Carlstadt, NJ
Something went wrong! Please refresh the page.
|
| |||||||||||||||||||||||||||||||||||||||||||||||||||||||||||||||||||||||||||||||||||||||||||||||||||||||||||||
2003 - 2018 National Fire Incident Reporting System (NFIRS) incidents
- Incident types reported to NFIRS in Carlstadt, NJ
- 73337.3%False Alarm
- 44322.5%Fire
- 38119.4%Hazardous Condition
- 1839.3%Service Call
- 1366.9%Good Intent Call
- 512.6%Rescue & EMS
- 331.7%Special Incident
- 40.2%Severe Weather
- Fire incident types reported to NFIRS in Carlstadt, NJ
- 17038.4%Structure Fires
- 15735.4%Outside Fires
- 10924.6%Mobile Property/Vehicle Fires
- 71.6%Other
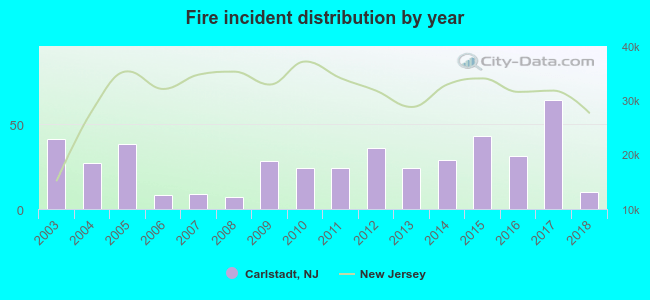 Based on the data from the years 2003 - 2018 the average number of fires per year is 28. The highest number of reported fire incidents - 64 took place in 2017, and the least - 7 in 2008. The data has a decreasing trend.
The average number of yearly fire incidents per 10k residents in Carlstadt, NJ compared to nearest cities:
(Note: Based on data for the last 3 years, including only cities with population 5,000 and above)
| Carlstadt: | 56.0 |
| East Rutherford: | 192.9 |
| Rutherford: | 45.3 |
| Hasbrouck Heights: | 18.9 |
| Wallington: | 24.1 |
| Little Ferry: | 19.0 |
| Lyndhurst: | 39.0 |
| Lodi: | 24.5 |
| Passaic: | 35.8 |

 37.5% incidents where reported in the morning and 62.5% in the evening. The most fires (17.8%) took place on Monday, and the least (11.7%) on Sunday.
 Based on the 443 fires from years 2003 - 2018 most fires (12.4%) took place during April, and the least (3.8%) in December.
 Out of all 1,965 cases reported during the years 2003 - 2018, the most belonged to the categories: False Alarm (37.3%), Fire (22.5%), and Hazardous Condition (19.4%).
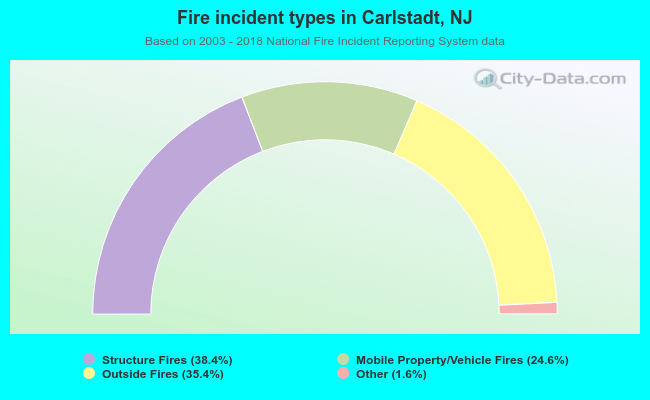 When looking into fire subcategories, the most reports belonged to: Structure Fires (38.4%), and Outside Fires (35.4%).