Casa Grande: Fire Incidents, Arizona (AZ)
Where are fire incidents reported in Casa Grande, AZ
Something went wrong! Please refresh the page.
| Fire incidents reported | |
|---|---|
| Sreet name | Count |
| FLORENCE BLVD | 482 |
| PINAL AVE | 418 |
| TREKELL RD | 292 |
| I-10 INST | 192 |
| PEART RD | 160 |
| CASA GRANDE AVE | 140 |
| GILA BEND HWY | 134 |
| KADOTA AVE | 126 |
| JIMMIE KERR BLVD | 112 |
| COTTONWOOD LN | 98 |
| THORNTON RD | 98 |
| FRENCH ST | 96 |
| CENTER AVE | 86 |
| MORRISON AVE | 86 |
| MCMURRAY BLVD | 84 |
| 12TH ST | 70 |
| PUEBLO DR | 68 |
| BROWN AVE | 66 |
| HENNESS RD | 64 |
| 10TH ST | 60 |
| 2ND ST | 60 |
| I10 | 60 |
| SELMA HWY | 60 |
| OVERFIELD RD | 56 |
| 9TH ST | 54 |
| SAGUARO ST | 54 |
| 13TH ST | 52 |
| CAMERON AVE | 52 |
| ARIZOLA RD | 48 |
| COOLIDGE AVE | 48 |
| Other | 208 |
2003 - 2018 National Fire Incident Reporting System (NFIRS) incidents
- Incident types reported to NFIRS in Casa Grande, AZ
- 22,94665.6%Rescue & EMS
- 3,68410.5%Fire
- 2,9268.4%Service Call
- 2,5927.4%Good Intent Call
- 1,4074.0%Hazardous Condition
- 1,2743.6%False Alarm
- 1290.4%Overpressure Rupture
- Fire incident types reported to NFIRS in Casa Grande, AZ
- 2,00354.4%Outside Fires
- 82322.3%Structure Fires
- 64717.6%Mobile Property/Vehicle Fires
- 2115.7%Other
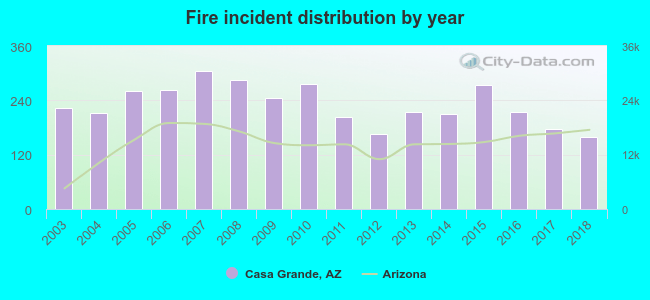 Based on the data from the years 2003 - 2018 the average number of fire incidents per year is 230. The highest number of fire incidents - 305 took place in 2007, and the least - 158 in 2018. The data has a decreasing trend.
The average number of yearly fire incidents per 10k residents in Casa Grande, AZ compared to nearest cities:
(Note: Based on data for the last 3 years, including only cities with population 5,000 and above)
| Casa Grande: | 35.5 |
| Arizona City: | 29.1 |
| Eloy: | 54.6 |
| Coolidge: | 51.9 |
| Gila River: | 1.4 |
| Maricopa: | 8.4 |
| Florence: | 5.7 |
| Sun Lakes: | 19.1 |
| San Tan Valley: | 0.3 |
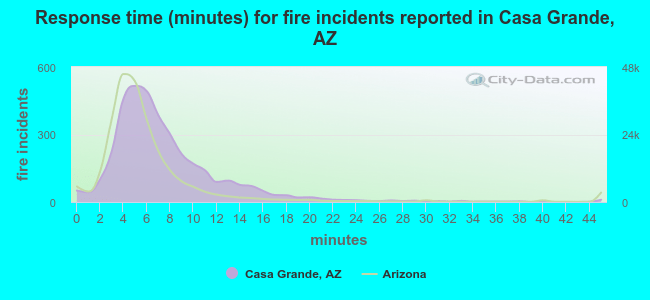 The median response time based on all reported fire incidents is 6 minutes. This is close to the state median value.
The median response time in Casa Grande, AZ compared to nearest cities:
(Note: Based on data for all years, including only cities with at least 500 fire incidents)
| Casa Grande: | 6 minutes |
| Eloy: | 7 minutes |
| Coolidge: | 6 minutes |
| Florence: | 7 minutes |
| Queen Creek: | 6 minutes |
| Chandler: | 5 minutes |
| Gilbert: | 5 minutes |
| Mesa: | 5 minutes |
| Tempe: | 4 minutes |
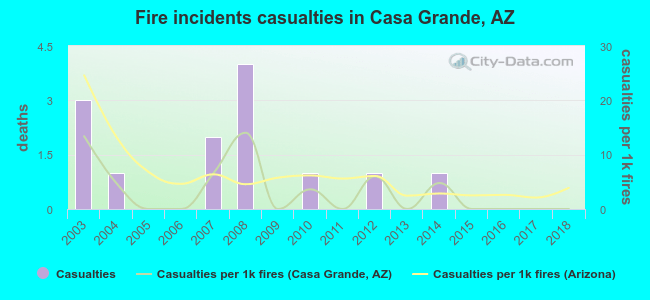 Based on the data from the years 2003 - 2018 the average number of fire-related yearly casualties is 1. The highest number of casualties - 4 took place in 2008, and the lowest - 0 in 2005. The data has a decreasing trend.
The average number of injuries per 1,000 fires is 3. This indicator was the highest - 14 in 2008, and the lowest 0 in 2005. The trend for injuries per 1,000 incidents is dropping. Compared to the Arizona value the number of casualties per 1,000 fires is lower.
Based on the data from the years 2003 - 2018 the average number of fire-related yearly casualties is 1. The highest number of casualties - 4 took place in 2008, and the lowest - 0 in 2005. The data has a decreasing trend.
The average number of injuries per 1,000 fires is 3. This indicator was the highest - 14 in 2008, and the lowest 0 in 2005. The trend for injuries per 1,000 incidents is dropping. Compared to the Arizona value the number of casualties per 1,000 fires is lower.
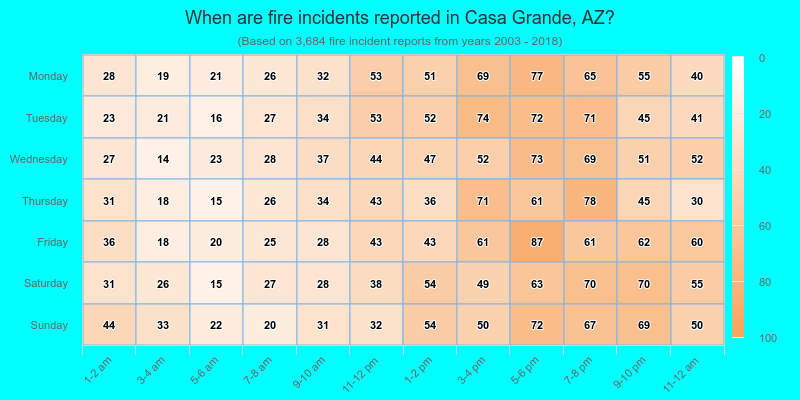
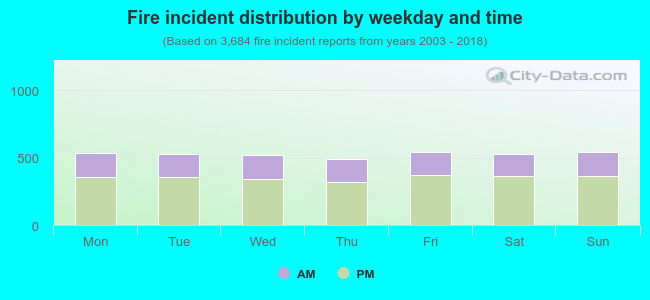 32.8% incidents where reported in the morning and 67.2% in the evening. The most fires (14.8%) took place on Friday, and the least (13.2%) on Thursday.
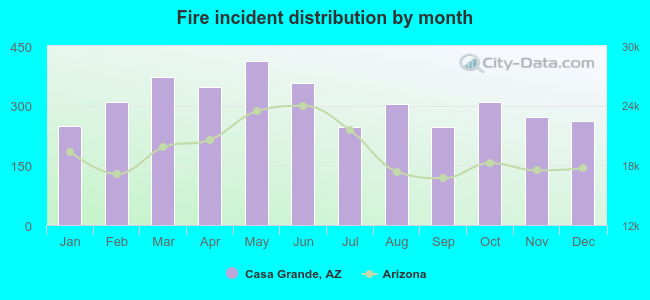 According to the 3,684 fires from years 2003 - 2018 most fires (11.2%) took place during May, and the least (6.7%) in September.
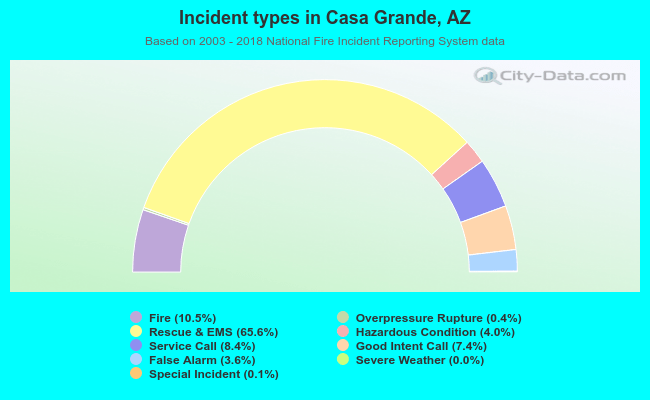 Out of all 34,992 cases reported during the years 2003 - 2018, the most belonged to the categories: Rescue & EMS (65.6%), Fire (10.5%), and Service Call (8.4%).
 When looking into fire subcategories, the most incidents belonged to: Outside Fires (54.4%), and Structure Fires (22.3%).