| Fire incidents reported |
|---|
| Sreet name | Count |
|---|
| NAHAHUM CANYON RD | 26 | | SUNSET HWY | 18 | | OLD MONITOR RD RD | 12 | | US 2 HWY | 12 | | NAHAHUM CYN | 8 | | RED APPLE RD | 8 | | BRENDER CANYON RD | 6 | | BRISKY CANYON RD | 6 | | COTTAGE AVE | 6 | | MILL RD | 6 | | MISSION CREEK RD | 6 | | NAHAHUM CANYON | 6 | | SR2 | 6 | | US 2 | 6 | | 3620 EELS RD. | 4 | | 4270 MISSION CREEK RD. | 4 | | BARDIN JAMES RD | 4 | | BRENDER CANYON | 4 | | BUTLER RD | 4 | | CASHMERE RD | 4 | | EELS RD | 4 | | HARNDEN RD | 4 | | HAY CANYON RD | 4 | | HWY. 2 | 4 | | MISSION CREEK RD | 4 |
| | | Fire incidents reported |
|---|
| Sreet name | Count |
|---|
| MISSION CREEK ROAD | 4 | | NAHAHUM CANYON RD. | 4 | | NAHAHUM CANYON ROAD | 4 | | NORTH | 4 | | NORTH DRYDEN RD | 4 | | OLD BLEWITT PASS RD RD | 4 | | PIONEER DR | 4 | | RED APPLE RD. | 4 | | RIVER ST. ST | 4 | | SR 2 | 4 | | TIGNER RD | 4 | | TITCHENAL WAY | 4 | | TRIPP CANYON RD | 4 | | TURKEY SHOOT RD. | 4 | | #1 CYN | 2 | | 100 N ST | 2 | | 1000 WEATHEREND DRIVE | 2 | | 101 MOUNTAIN VIEW PL. | 2 | | 104 CEDAR ST | 2 | | 108 CREEKSIDE PL. | 2 | | 109 JULIE ANN CT | 2 | | 117 CHAPEL ST | 2 | | 130 TITCHENAL WAY | 2 | | 1500 BINDER RD. | 2 | | |
|
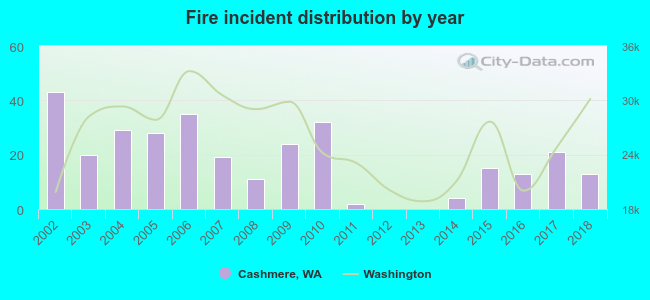 According to the data from the years 2002 - 2018 the average number of fire incidents per year is 18. The highest number of fires - 43 took place in 2002, and the least - 0 in 2012. The data has a dropping trend.
 33.0% incidents where reported in the morning and 67.0% in the evening. The most fires (17.5%) took place on Saturday, and the least (10.7%) on Wednesday.
 According to the 309 fire incidents from years 2002 - 2018 most fires (18.1%) took place during July, and the least (4.2%) in January.
 Out of all 1,139 cases reported during the years 2002 - 2018, the most belonged to the categories: Rescue & EMS (39.6%), Fire (27.1%), and Good Intent Call (13.5%).
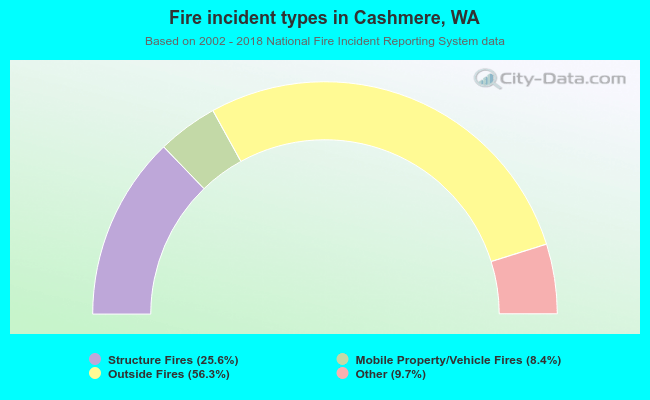 When looking into fire subcategories, the most incidents belonged to: Outside Fires (56.3%), and Structure Fires (25.6%).