Cave Spring: Fire Incidents, Georgia (GA)
Where are fire incidents reported in Cave Spring, GA
Something went wrong! Please refresh the page.
|
| |||||||||||||||||||||||||||||||||||||||||||||||||||||||||||||||||||||||||||||||||||||||||||||||||||||||||||||
2005 - 2018 National Fire Incident Reporting System (NFIRS) incidents
- Incident types reported to NFIRS in Cave Spring, GA
- 43527.3%Fire
- 39624.8%Rescue & EMS
- 35021.9%Good Intent Call
- 21413.4%Hazardous Condition
- 1318.2%Service Call
- 654.1%False Alarm
- 20.1%Special Incident
- Fire incident types reported to NFIRS in Cave Spring, GA
- 24355.9%Outside Fires
- 14032.2%Structure Fires
- 4911.3%Mobile Property/Vehicle Fires
- 30.7%Other
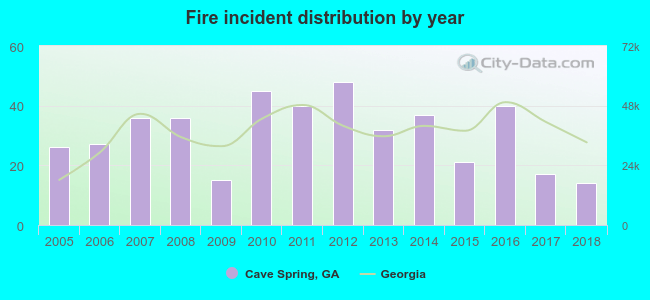 Based on the data from the years 2005 - 2018 the average number of fires per year is 31. The highest number of reported fire incidents - 48 took place in 2012, and the least - 14 in 2018. The data has a dropping trend.
 According to the data from the years 2005 - 2018 the average number of fire-related yearly casualties is 1. The highest number of reported injuries - 4 took place in 2010, and the lowest - 0 in 2006. The data has a declining trend.
 23.7% incidents where reported in the morning and 76.3% in the evening. The most fires (19.3%) took place on Saturday, and the least (10.3%) on Thursday.
 According to the 435 reports from years 2005 - 2018 most fires (13.3%) took place during November, and the least (3.7%) in December.
 Out of all 1,595 cases reported during the years 2005 - 2018, the most belonged to the categories: Fire (27.3%), Rescue & EMS (24.8%), and Good Intent Call (21.9%).
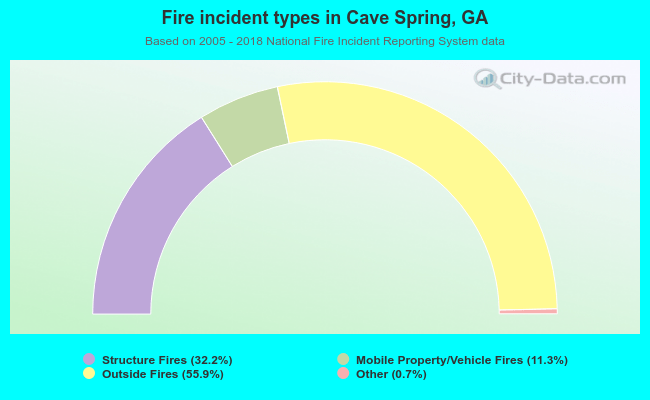 When looking into fire subcategories, the most incidents belonged to: Outside Fires (55.9%), and Structure Fires (32.2%).