Cedar Grove: Fire Incidents, Wisconsin (WI)
Where are fire incidents reported in Cedar Grove, WI
Something went wrong! Please refresh the page.
|
| |||||||||||||||||||||||||||||||||||||||||||||||||||||||||||||||||||||||||||||||||||||||||||||||||||||||||||||
2002 - 2018 National Fire Incident Reporting System (NFIRS) incidents
- Incident types reported to NFIRS in Cedar Grove, WI
- 10356.0%Fire
- 2614.1%Hazardous Condition
- 1910.3%False Alarm
- 179.2%Rescue & EMS
- 84.3%Service Call
- 84.3%Good Intent Call
- 21.1%Special Incident
- 10.5%Severe Weather
- Fire incident types reported to NFIRS in Cedar Grove, WI
- 8077.7%Structure Fires
- 1110.7%Other
- 87.8%Mobile Property/Vehicle Fires
- 43.9%Outside Fires
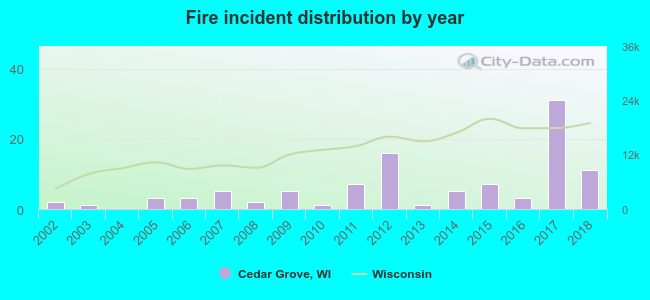 Based on the data from the years 2002 - 2018 the average number of fires per year is 6. The highest number of fires - 31 took place in 2017, and the least - 0 in 2004. The data has a growing trend.
 42.7% incidents where reported in the morning and 57.3% in the evening. The most fires (22.3%) took place on Thursday, and the least (6.8%) on Tuesday.
 According to the 103 fire incidents from years 2002 - 2018 most fires (26.2%) took place during February, and the least (1.9%) in March.
 Out of all 184 cases reported during the years 2002 - 2018, the most belonged to the categories: Fire (56.0%), Rescue & EMS (14.1%), and Good Intent Call (10.3%).
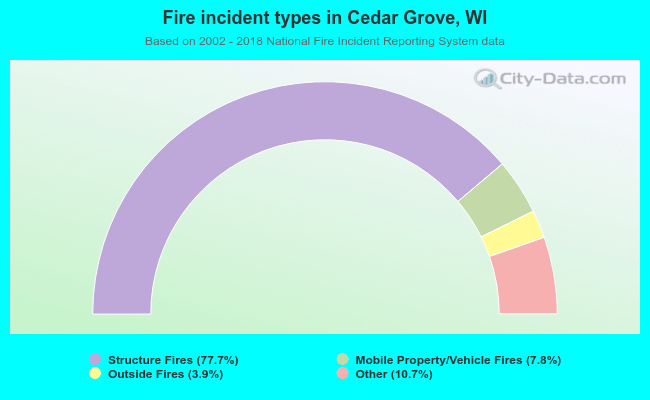 When looking into fire subcategories, the most reports belonged to: Structure Fires (77.7%), and Other (10.7%).