Chambersburg: Fire Incidents, Pennsylvania (PA)
Where are fire incidents reported in Chambersburg, PA
Something went wrong! Please refresh the page.
| Fire incidents reported | |
|---|---|
| Sreet name | Count |
| LINCOLN WAY | 86 |
| WARM SPRING (001-1499) RD | 86 |
| PHILADELPHIA (200-1599) AVE | 64 |
| MAIN-CHBG (200-1579) ST | 60 |
| LINCOLN (00100-00700) WAY | 56 |
| LINCOLN (01601-04699) WAY | 52 |
| MENNO-VILLAGE (2075-2075) COMP | 48 |
| MAIN ST | 44 |
| WAYNE (300-1099) AVE | 44 |
| LINCOLN (00001-01200) WAY | 40 |
| LOOP (1900-2302) RD | 38 |
| SOLLENBERGER (001-2799) RD | 38 |
| CATHERINE (001-899) ST | 34 |
| LINCOLN (00001-00099) WAY | 34 |
| LINCOLN WAY EAST | 34 |
| SECOND (200-799) ST | 34 |
| LINCOLN (01201-01600) WAY | 32 |
| EDENVILLE (0870-3600) RD | 30 |
| LINCOLN (01000-03474) WAY | 30 |
| PHILADELPHIA (1600-4499) AVE | 30 |
| WAYNE11003415 RD | 30 |
| I-81 (10001-16000) LN | 28 |
| LINCOLN0160104699 WAY | 28 |
| PHILADELPHIA AVE | 28 |
| WARM SPRING0011499 RD | 28 |
| FRANK (1101-2199) RD | 26 |
| GUITNER (4300-5747) RD | 26 |
| LINCOLN WAY WEST | 26 |
| MAIN001199 ST | 26 |
| MAIN2001579 ST | 26 |
| Other | 2,861 |
2002 - 2018 National Fire Incident Reporting System (NFIRS) incidents
- Incident types reported to NFIRS in Chambersburg, PA
- 7,84646.2%Rescue & EMS
- 4,04723.9%Fire
- 2,42014.3%Hazardous Condition
- 1,1066.5%Good Intent Call
- 9345.5%False Alarm
- 5713.4%Service Call
- 180.1%Overpressure Rupture
- Fire incident types reported to NFIRS in Chambersburg, PA
- 2,73867.7%Structure Fires
- 80519.9%Outside Fires
- 3568.8%Mobile Property/Vehicle Fires
- 1483.7%Other
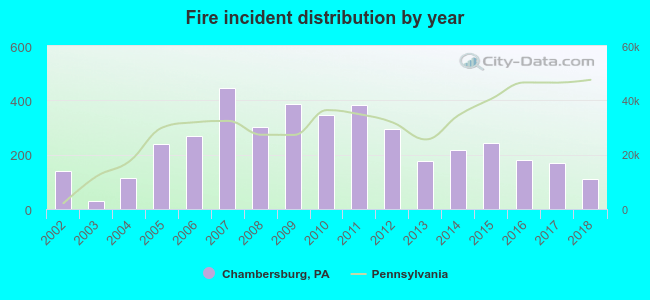 Based on the data from the years 2002 - 2018 the average number of fires per year is 238. The highest number of reported fires - 446 took place in 2007, and the least - 30 in 2003. The data has a declining trend.
The average number of yearly fire incidents per 10k residents in Chambersburg, PA compared to nearest cities:
(Note: Based on data for the last 3 years, including only cities with population 5,000 and above)
| Chambersburg: | 74.6 |
| Shippensburg: | 122.1 |
| Waynesboro: | 61.6 |
| Gettysburg: | 106.1 |
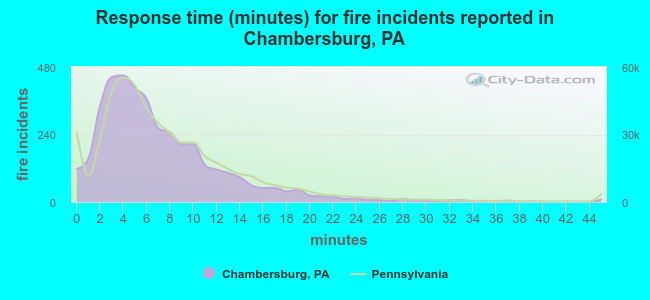 The median response time based on all reported fire incidents is 6 minutes. This is similar to the state median value.
The median response time in Chambersburg, PA compared to nearest cities:
(Note: Based on data for all years, including only cities with at least 500 fire incidents)
| Chambersburg: | 6 minutes |
| Fayetteville: | 7 minutes |
| Shippensburg: | 7 minutes |
| Waynesboro: | 8 minutes |
| Mercersburg: | 11 minutes |
| Smithsburg: | 10 minutes |
| Hagerstown: | 5 minutes |
| Newville: | 11 minutes |
| Gettysburg: | 11 minutes |
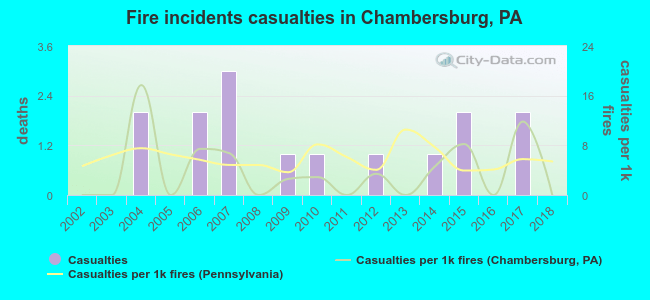 According to the reports from the years 2002 - 2018 the average number of fire-related casualties per year is 1. The highest number of reported casualties - 3 took place in 2007, and the lowest - 0 in 2002. The data has a constant trend.
The average number of injuries per 1,000 fire incidents is 4. This indicator was the highest - 18 in 2004, and the lowest 0 in 2002. The trend for casualties per 1,000 incidents is constant. Compared to the state value the number of injuries per 1,000 incidents is lower.
According to the reports from the years 2002 - 2018 the average number of fire-related casualties per year is 1. The highest number of reported casualties - 3 took place in 2007, and the lowest - 0 in 2002. The data has a constant trend.
The average number of injuries per 1,000 fire incidents is 4. This indicator was the highest - 18 in 2004, and the lowest 0 in 2002. The trend for casualties per 1,000 incidents is constant. Compared to the state value the number of injuries per 1,000 incidents is lower.Casualties per 1,000 incidents in Chambersburg, PA compared to nearest cities:
(Note: Based on data for all years, including only cities with at least 500 fire incidents)
| Chambersburg: | 3.7 |
| Fayetteville: | 2.4 |
| Shippensburg: | 1.6 |
| Waynesboro: | 0.0 |
| Mercersburg: | 3.2 |
| Smithsburg: | 0.9 |
| Hagerstown: | 20.0 |
| Newville: | 0.0 |
| Gettysburg: | 4.4 |
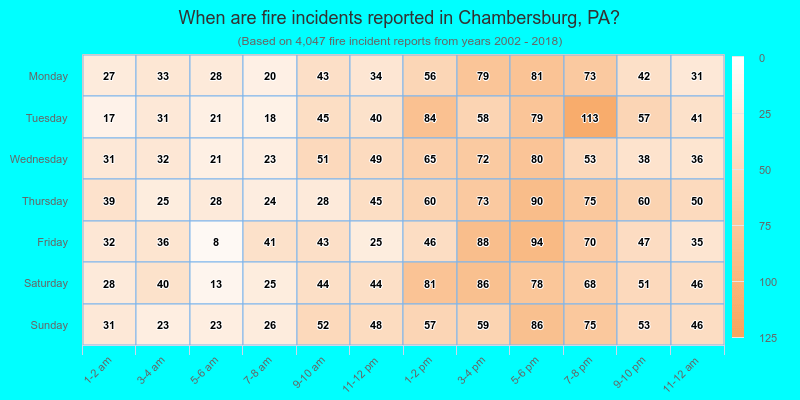
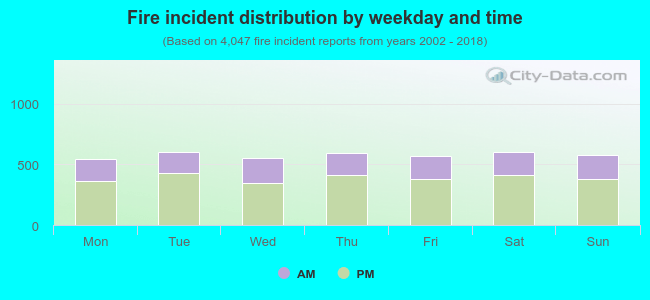 33.0% incidents where reported in the morning and 67.0% in the evening. The most fires (14.9%) took place on Tuesday, and the least (13.5%) on Monday.
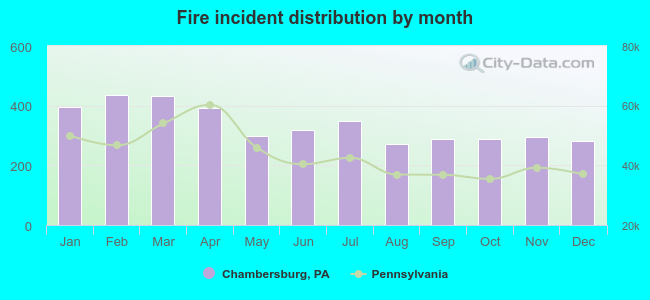 Based on the 4,047 fire incident reports from years 2002 - 2018 most fires (10.7%) took place during February, and the least (6.7%) in August.
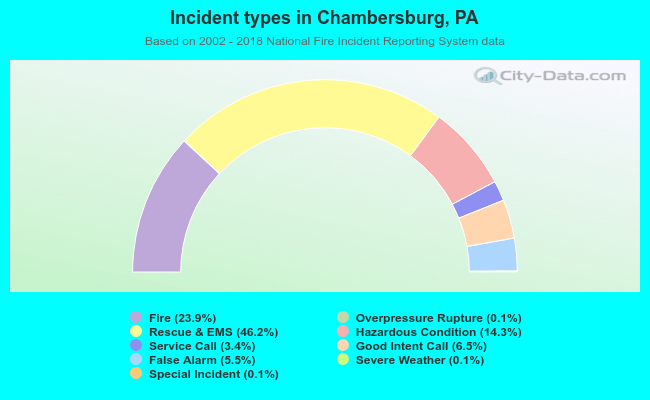 Out of all 16,966 cases reported during the years 2002 - 2018, the most belonged to the categories: Rescue & EMS (46.2%), Fire (23.9%), and Hazardous Condition (14.3%).
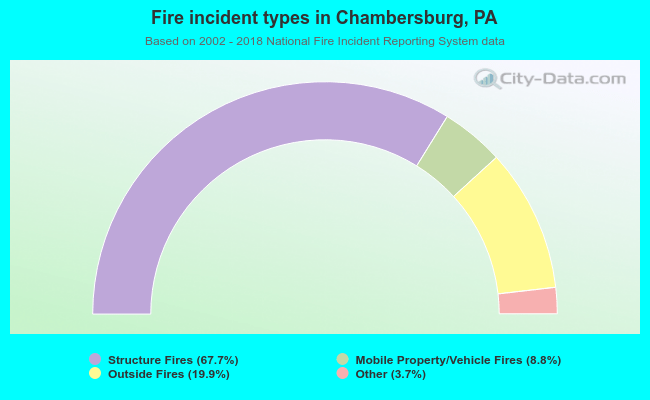 When looking into fire subcategories, the most incidents belonged to: Structure Fires (67.7%), and Outside Fires (19.9%).