| Fire incidents reported |
|---|
| Sreet name | Count |
|---|
| ZOAR RD | 20 | | ROUTE 2 | 18 | | MAIN ST | 16 | | MOHAWK TRAIL | 14 | | HIGH ST | 10 | | ROUTE 2 HWY | 10 | | FIRE STATION | 8 | | LEGATE HILL RD | 8 | | MAIN STREET | 8 | | MOHAWK TRL | 8 | | 119 MAIN STREET | 6 | | 149 LEGATE HILL ROAD | 6 | | 2 RT | 6 | | HAWLEY RD | 6 | | RTE 2 | 6 | | TEA ST | 6 | | 1701 ROUTE TWO | 4 | | 174 MAIN STREET | 4 | | 175 MOHAWK TRAIL | 4 | | 82 8A NORTH | 4 | | MOUNTAIN RD | 4 | | OXBOW RD | 4 | | RAILROAD CROSSING | 4 | | RIDDELL ROAD AVERY CAMP | 4 | | SOUTH RIVER RD | 4 |
| | | Fire incidents reported |
|---|
| Sreet name | Count |
|---|
| THUNDER MOUNTAIN RD | 4 | | ZOAR ROAD | 4 | | 10 SCHOOL STREET | 2 | | 100 WARFIELD ROAD | 2 | | 1015 MOHAWK TRAIL | 2 | | 104 MAIN STREET | 2 | | 105 POTTER ROAD | 2 | | 1165 ROUTE 2 | 2 | | 1177 ROUTE TWO | 2 | | 124 WEST OXBOW ROAD | 2 | | 1255 ROUTE TWO | 2 | | 1255 RTE 2 | 2 | | 129 MAIN STREET | 2 | | 130 MAIN STREET | 2 | | 130MAIN STREET | 2 | | 1345 ROUTE 2 | 2 | | 14 HARMONY HEIGHTS | 2 | | 142 HAWK HILL ROAD | 2 | | 15 N RIVER RD | 2 | | 1507 ROUTE 2 | 2 | | 1509 ROUTE 2 | 2 | | 151 MAIN STREET | 2 | | 154 MAIN STREET | 2 | | 16 AVERY BROOK ROAD | 2 | | |
|
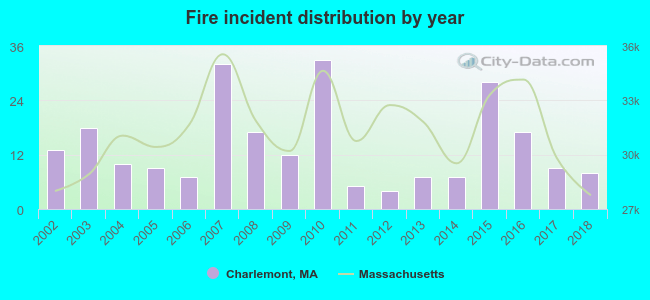 Based on the data from the years 2002 - 2018 the average number of fires per year is 14. The highest number of fire incidents - 33 took place in 2010, and the least - 4 in 2012. The data has a decreasing trend.
 28.8% incidents where reported in the morning and 71.2% in the evening. The most fires (25.8%) took place on Thursday, and the least (9.3%) on Monday.
 Based on the 236 incident reports from years 2002 - 2018 most fires (22.9%) took place during April, and the least (4.2%) in June.
 Out of all 606 cases reported during the years 2002 - 2018, the most belonged to the categories: Fire (38.9%), Overpressure Rupture (18.8%), and Rescue & EMS (17.7%).
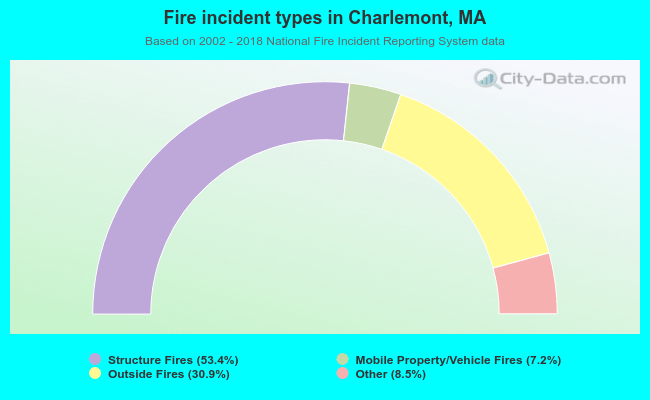 When looking into fire subcategories, the most reports belonged to: Structure Fires (53.4%), and Outside Fires (30.9%).