Charleston: Fire Incidents, South Carolina (SC)
Where are fire incidents reported in Charleston, SC
Something went wrong! Please refresh the page.
| Fire incidents reported | |
|---|---|
| Sreet name | Count |
| ASHLEY RIVER RD | 452 |
| SAVANNAH HWY | 436 |
| KING ST | 426 |
| SAM RITTENBERG BLVD | 304 |
| FOLLY RD | 278 |
| MEETING ST | 238 |
| ROMNEY ST | 230 |
| ASHLEY HALL RD | 192 |
| MOUNT PLEASANT ST | 140 |
| SPRING ST | 128 |
| MAYBANK HWY | 126 |
| RUTLEDGE AVE | 116 |
| CLEMENTS FERRY RD | 108 |
| BAY ST | 106 |
| CALHOUN ST | 96 |
| ORANGE GROVE RD | 92 |
| FORT JOHNSON RD | 90 |
| ASHLEY HALL PLANTATION RD | 88 |
| CAMP RD | 88 |
| MARKET ST | 88 |
| RIVERLAND DR | 86 |
| SAINT PHILIP ST | 80 |
| LOCKWOOD DR | 76 |
| HANOVER ST | 72 |
| LINE ST | 72 |
| WAPPOO RD | 68 |
| ASHLEY AVE | 66 |
| CENTRAL PARK RD | 66 |
| ROYAL PALM BLVD | 66 |
| BEES FERRY RD | 64 |
| Other | 4,021 |
2006 - 2018 National Fire Incident Reporting System (NFIRS) incidents
- Incident types reported to NFIRS in Charleston, SC
- 61,23849.5%Rescue & EMS
- 27,79922.5%Good Intent Call
- 12,99110.5%False Alarm
- 8,5596.9%Fire
- 6,3085.1%Hazardous Condition
- 6,1445.0%Service Call
- 3710.3%Special Incident
- 1740.1%Overpressure Rupture
- 1530.1%Severe Weather
- Fire incident types reported to NFIRS in Charleston, SC
- 4,29350.2%Structure Fires
- 2,82833.0%Outside Fires
- 1,20414.1%Mobile Property/Vehicle Fires
- 2342.7%Other
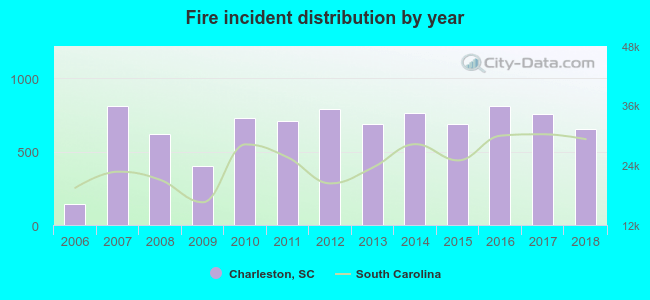 According to the data from the years 2006 - 2018 the average number of fires per year is 657. The highest number of fire incidents - 812 took place in 2007, and the least - 141 in 2006. The data has an increasing trend.
The average number of yearly fire incidents per 10k residents in Charleston, SC compared to nearest cities:
(Note: Based on data for the last 3 years, including only cities with population 5,000 and above)
| Charleston: | 56.7 |
| James Island: | 12.7 |
| North Charleston: | 73.9 |
| Johns Island: | 104.5 |
| Mount Pleasant: | 2.8 |
| Hanahan: | 29.4 |
| Wando: | 18.9 |
| Goose Creek: | 39.1 |
| Ladson: | 102.5 |
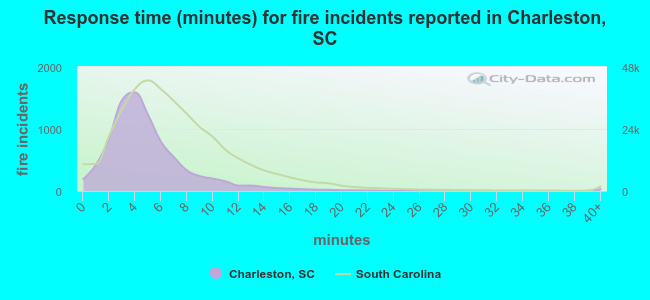 The median response time based on all reported fire incidents is 4 minutes. This is lower compared to the state median value.
The median response time in Charleston, SC compared to nearest cities:
(Note: Based on data for all years, including only cities with at least 500 fire incidents)
| Charleston: | 4 minutes |
| North Charleston: | 5 minutes |
| Johns Island: | 7 minutes |
| Mount Pleasant: | 6 minutes |
| Hollywood: | 5 minutes |
| Goose Creek: | 5 minutes |
| Ladson: | 5 minutes |
| Summerville: | 6 minutes |
| Moncks Corner: | 5 minutes |
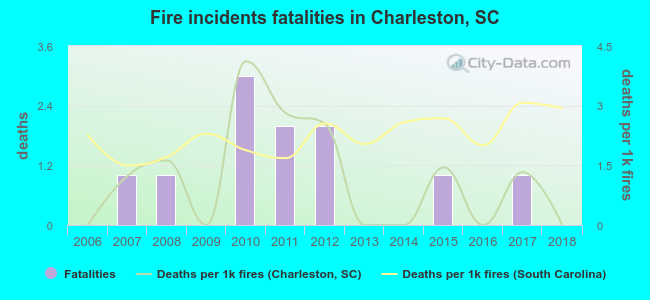 Based on the reports from the years 2006 - 2018 the average number of fire-related yearly deaths is 1. The highest number of deaths - 3 took place in 2010, and the lowest - 0 in 2006. The data has a constant trend.
The average number of deaths per 1,000 fire incidents is 1. This indicator was the highest - 4 in 2010, and the lowest 0 in 2006. The trend for deaths per 1,000 fires is constant. Compared to the South Carolina value the number of fatalities per 1,000 fire incidents is lower.
Based on the reports from the years 2006 - 2018 the average number of fire-related yearly deaths is 1. The highest number of deaths - 3 took place in 2010, and the lowest - 0 in 2006. The data has a constant trend.
The average number of deaths per 1,000 fire incidents is 1. This indicator was the highest - 4 in 2010, and the lowest 0 in 2006. The trend for deaths per 1,000 fires is constant. Compared to the South Carolina value the number of fatalities per 1,000 fire incidents is lower.Deaths per 1,000 incidents in Charleston, SC compared to nearest cities:
(Note: Based on data for all years, including only cities with at least 2,500 fire incidents)
| Charleston: | 1.3 |
| North Charleston: | 2.7 |
| Summerville: | 1.1 |
| Moncks Corner: | 2.0 |
| Walterboro: | 2.1 |
| Manning: | 0.0 |
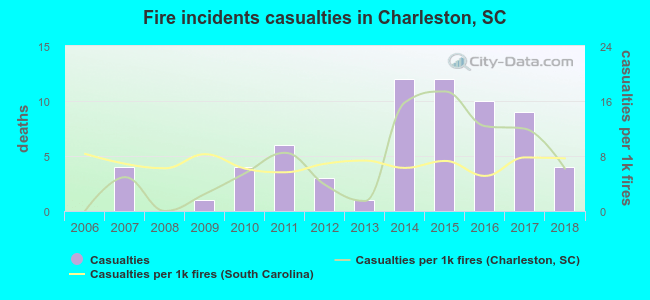 Based on the data from the years 2006 - 2018 the average number of fire-related casualties per year is 5. The highest number of reported casualties - 12 took place in 2014, and the lowest - 0 in 2006. The data has a growing trend.
The average number of injuries per 1,000 fire incidents is 7. This indicator was the highest - 17 in 2015, and the lowest 0 in 2006. The trend for injuries per 1,000 fires is increasing. Compared to the South Carolina value the number of casualties per 1,000 fires is similar.
Based on the data from the years 2006 - 2018 the average number of fire-related casualties per year is 5. The highest number of reported casualties - 12 took place in 2014, and the lowest - 0 in 2006. The data has a growing trend.
The average number of injuries per 1,000 fire incidents is 7. This indicator was the highest - 17 in 2015, and the lowest 0 in 2006. The trend for injuries per 1,000 fires is increasing. Compared to the South Carolina value the number of casualties per 1,000 fires is similar.Casualties per 1,000 incidents in Charleston, SC compared to nearest cities:
(Note: Based on data for all years, including only cities with at least 500 fire incidents)
| Charleston: | 7.7 |
| North Charleston: | 25.2 |
| Johns Island: | 9.4 |
| Mount Pleasant: | 18.4 |
| Hollywood: | 0.0 |
| Goose Creek: | 13.3 |
| Ladson: | 2.1 |
| Summerville: | 7.6 |
| Moncks Corner: | 3.3 |
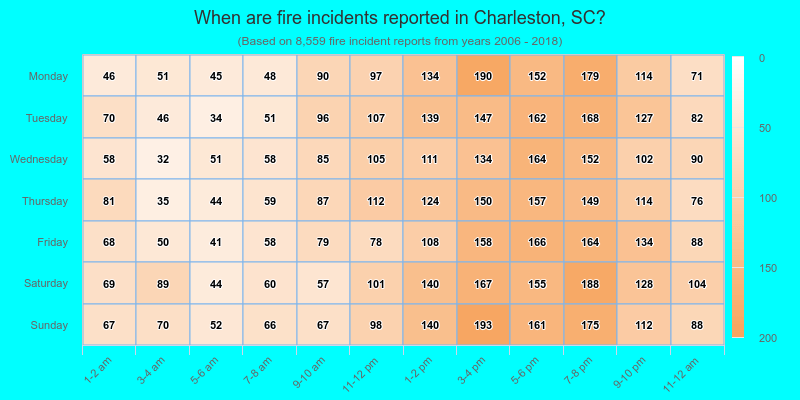
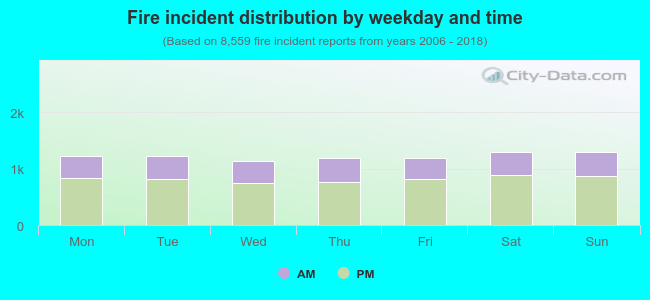 32.7% incidents where reported in the morning and 67.3% in the evening. The most fires (15.2%) took place on Saturday, and the least (13.3%) on Wednesday.
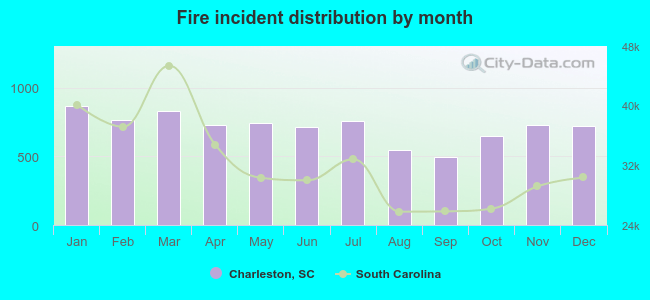 Based on the 8,559 fire incidents from years 2006 - 2018 most fires (10.2%) took place during January, and the least (5.8%) in September.
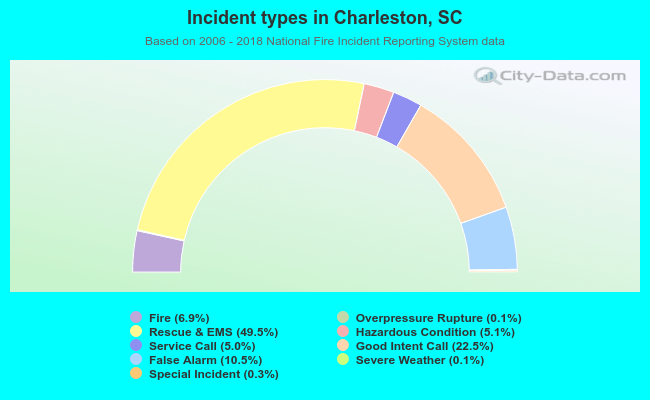 Out of all 123,737 cases reported during the years 2006 - 2018, the most belonged to the categories: Rescue & EMS (49.5%), Good Intent Call (22.5%), and False Alarm (10.5%).
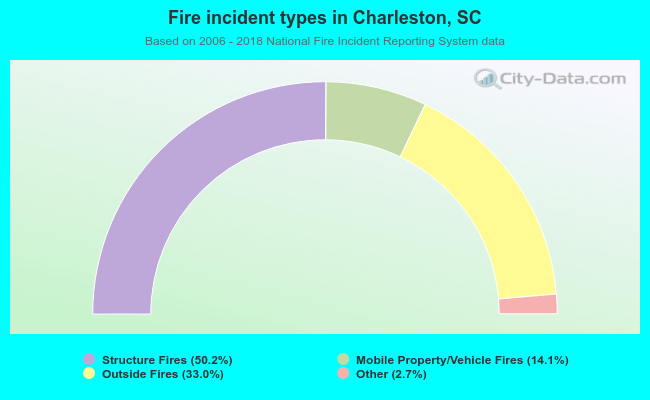 When looking into fire subcategories, the most reports belonged to: Structure Fires (50.2%), and Outside Fires (33.0%).