Charlotte: Fire Incidents, Tennessee (TN)
Where are fire incidents reported in Charlotte, TN
Something went wrong! Please refresh the page.
|
| |||||||||||||||||||||||||||||||||||||||||||||||||||||||||||||||||||||||||||||||||||||||||||||||||||||||||||||
| Other | 39 | |||||||||||||||||||||||||||||||||||||||||||||||||||||||||||||||||||||||||||||||||||||||||||||||||||||||||||||
2003 - 2018 National Fire Incident Reporting System (NFIRS) incidents
- Incident types reported to NFIRS in Charlotte, TN
- 60153.1%Fire
- 16214.3%Hazardous Condition
- 15914.1%Rescue & EMS
- 1008.8%Good Intent Call
- 716.3%False Alarm
- 242.1%Service Call
- 90.8%Severe Weather
- 30.3%Overpressure Rupture
- 20.2%Special Incident
- Fire incident types reported to NFIRS in Charlotte, TN
- 26443.9%Outside Fires
- 22036.6%Structure Fires
- 9115.1%Mobile Property/Vehicle Fires
- 264.3%Other
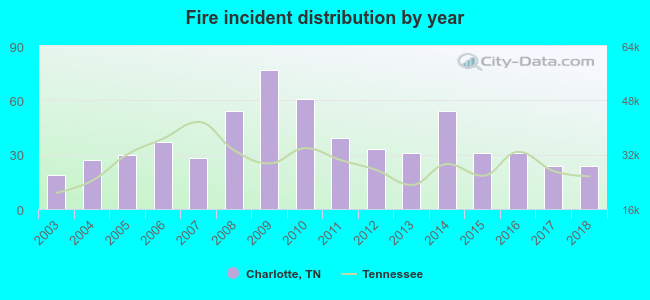 Based on the data from the years 2003 - 2018 the average number of fires per year is 38. The highest number of reported fires - 77 took place in 2009, and the least - 19 in 2003. The data has an increasing trend.
 The median response time based on all reported fire incidents is 7 minutes. This is close to the Tennessee median value.
The median response time in Charlotte, TN compared to nearest cities:
(Note: Based on data for all years, including only cities with at least 500 fire incidents)
| Charlotte: | 7 minutes |
| Dickson: | 6 minutes |
| White Bluff: | 6 minutes |
| McEwen: | 9 minutes |
| Ashland City: | 10 minutes |
| Fairview: | 9 minutes |
| Waverly: | 11 minutes |
| Clarksville: | 5 minutes |
| Franklin: | 6 minutes |
 Based on the reports from the years 2003 - 2018 the average number of fire-related fatalities per year is 0. The highest number of deaths - 1 took place in 2009, and the lowest - 0 in 2003. The data has a growing trend.
 29.3% incidents where reported in the morning and 70.7% in the evening. The most fires (18.5%) took place on Saturday, and the least (10.6%) on Wednesday.
 Based on the 601 fire incidents from years 2003 - 2018 most fires (13.6%) took place during March, and the least (3.8%) in June.
 Out of all 1,131 cases reported during the years 2003 - 2018, the most belonged to the categories: Fire (53.1%), Hazardous Condition (14.3%), and Rescue & EMS (14.1%).
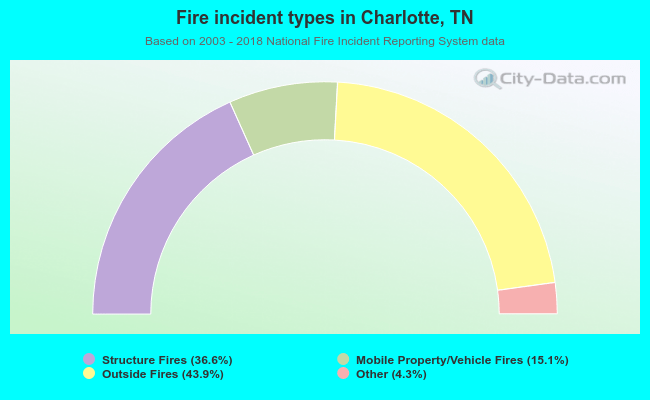 When looking into fire subcategories, the most reports belonged to: Outside Fires (43.9%), and Structure Fires (36.6%).