Circleville: Fire Incidents, Ohio (OH)
Where are fire incidents reported in Circleville, OH
Something went wrong! Please refresh the page.
| Fire incidents reported | |
|---|---|
| Sreet name | Count |
| TARLTON RD | 104 |
| US RTE 23 HWY | 96 |
| COURT ST | 86 |
| US RT 23 | 70 |
| MAIN ST | 50 |
| MILL ST | 50 |
| LOGAN ST | 48 |
| LANCASTER PIKE | 42 |
| OWENS RD | 40 |
| ISLAND RD | 34 |
| OTHER | 32 |
| PITTSBURG RD | 32 |
| PICKAWAY ST | 26 |
| CLINTON ST | 22 |
| COURT STREET SOUTH | 20 |
| JACKSON RD | 20 |
| SR 361 | 20 |
| ST RT 56 | 20 |
| WALNUT ST | 20 |
| COURT STREET NORTH | 18 |
| HEFFNER RD | 18 |
| ST RT 104 | 18 |
| STATE ROUTE 56 | 18 |
| ATWATER AVE | 16 |
| CORWIN ST | 16 |
| SR 56 | 16 |
| ST RT 22 W | 16 |
| STOUTSVILLE PIKE | 16 |
| US RT 22 | 16 |
| WASHINGTON ST | 16 |
| Other | 808 |
2002 - 2018 National Fire Incident Reporting System (NFIRS) incidents
- Incident types reported to NFIRS in Circleville, OH
- 2,27136.7%Rescue & EMS
- 1,82429.5%Fire
- 1,05917.1%Hazardous Condition
- 3555.7%False Alarm
- 3545.7%Service Call
- 2854.6%Good Intent Call
- 180.3%Overpressure Rupture
- 150.2%Special Incident
- Fire incident types reported to NFIRS in Circleville, OH
- 94451.8%Structure Fires
- 61433.7%Outside Fires
- 24613.5%Mobile Property/Vehicle Fires
- 201.1%Other
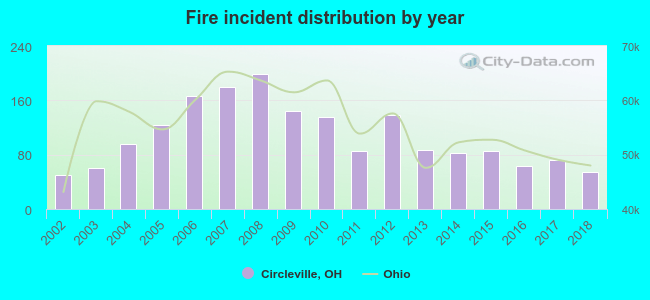 According to the data from the years 2002 - 2018 the average number of fire incidents per year is 107. The highest number of reported fires - 199 took place in 2008, and the least - 50 in 2002. The data has a growing trend.
The average number of yearly fire incidents per 10k residents in Circleville, OH compared to nearest cities:
(Note: Based on data for the last 3 years, including only cities with population 5,000 and above)
| Circleville: | 47.1 |
| Groveport: | 111.7 |
| Canal Winchester: | 90.9 |
| Chillicothe: | 128.5 |
| Lancaster: | 65.3 |
| Grove City: | 17.6 |
| Pickerington: | 30.2 |
| Bexley: | 9.6 |
| Whitehall: | 50.3 |
 The median response time based on all reported fire incidents is 9 minutes. This is higher compared to the state median value.
The median response time in Circleville, OH compared to nearest cities:
(Note: Based on data for all years, including only cities with at least 500 fire incidents)
| Circleville: | 9 minutes |
| Ashville: | 9 minutes |
| Amanda: | 13 minutes |
| Laurelville: | 11 minutes |
| Groveport: | 5 minutes |
| Canal Winchester: | 5 minutes |
| Carroll: | 8 minutes |
| Chillicothe: | 9 minutes |
| Lancaster: | 5 minutes |
 According to the data from the years 2002 - 2018 the average number of fire-related yearly casualties is 1. The highest number of reported injuries - 2 took place in 2004, and the lowest - 0 in 2002. The data has a constant trend.
The average number of injuries per 1,000 fires is 6. This indicator was the highest - 24 in 2011, and the lowest 0 in 2002. The trend for casualties per 1,000 fires is constant. Compared to the state value the number of injuries per 1,000 fire incidents is much lower.
According to the data from the years 2002 - 2018 the average number of fire-related yearly casualties is 1. The highest number of reported injuries - 2 took place in 2004, and the lowest - 0 in 2002. The data has a constant trend.
The average number of injuries per 1,000 fires is 6. This indicator was the highest - 24 in 2011, and the lowest 0 in 2002. The trend for casualties per 1,000 fires is constant. Compared to the state value the number of injuries per 1,000 fire incidents is much lower.Casualties per 1,000 incidents in Circleville, OH compared to nearest cities:
(Note: Based on data for all years, including only cities with at least 500 fire incidents)
| Circleville: | 6.0 |
| Ashville: | 1.3 |
| Amanda: | 0.0 |
| Laurelville: | 0.0 |
| Groveport: | 14.2 |
| Canal Winchester: | 5.9 |
| Carroll: | 1.3 |
| Chillicothe: | 9.5 |
| Lancaster: | 12.7 |
 32.1% incidents where reported in the morning and 67.9% in the evening. The most fires (16.4%) took place on Sunday, and the least (13.7%) on Monday.
 According to the 1,824 reports from years 2002 - 2018 most fires (9.6%) took place during March, and the least (6.6%) in January.
 Out of all 6,183 cases reported during the years 2002 - 2018, the most belonged to the categories: Rescue & EMS (36.7%), Fire (29.5%), and Hazardous Condition (17.1%).
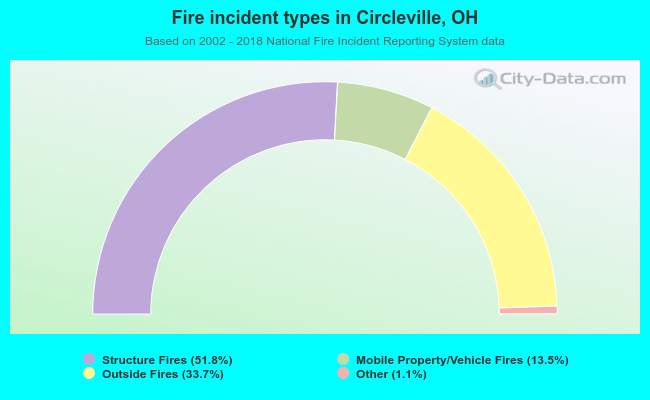 When looking into fire subcategories, the most incidents belonged to: Structure Fires (51.8%), and Outside Fires (33.7%).