Clermont: Fire Incidents, Florida (FL)
Where are fire incidents reported in Clermont, FL
Something went wrong! Please refresh the page.
| Fire incidents reported | |
|---|---|
| Sreet name | Count |
| US HWY 27 | 246 |
| 50 HWY | 226 |
| CR 561 | 158 |
| 27 HWY | 138 |
| SR 50 | 110 |
| CITRUS TOWER BLVD | 98 |
| JOHNS LAKE RD | 96 |
| HARTWOOD MARSH RD | 90 |
| 27 | 86 |
| HANCOCK RD | 74 |
| HWY 27 | 74 |
| LAKESHORE DR | 64 |
| SR 33 | 56 |
| HUNT ST | 50 |
| HWY 50 | 50 |
| OIL WELL RD | 50 |
| CR 474 | 48 |
| MONTROSE ST | 48 |
| 50 | 46 |
| GREEN SWAMP RD | 46 |
| LAKE NELLIE RD | 46 |
| RAINTREE BEND | 46 |
| CAGAN CROSSINGS BLVD | 44 |
| 12TH ST | 40 |
| CR 455 | 40 |
| RIVER BIRCH CT | 40 |
| MINNEOLA AVE | 38 |
| GRAND HWY | 36 |
| SARAHS PLACE | 36 |
| HIGHLAND AVE | 34 |
| Other | 1,717 |
2002 - 2018 National Fire Incident Reporting System (NFIRS) incidents
- Incident types reported to NFIRS in Clermont, FL
- 28,53059.0%Rescue & EMS
- 5,15210.7%Good Intent Call
- 4,4199.1%Hazardous Condition
- 3,9718.2%Fire
- 3,3947.0%Service Call
- 2,7185.6%False Alarm
- 660.1%Severe Weather
- 560.1%Special Incident
- Fire incident types reported to NFIRS in Clermont, FL
- 1,90347.9%Outside Fires
- 1,16629.4%Structure Fires
- 81120.4%Mobile Property/Vehicle Fires
- 912.3%Other
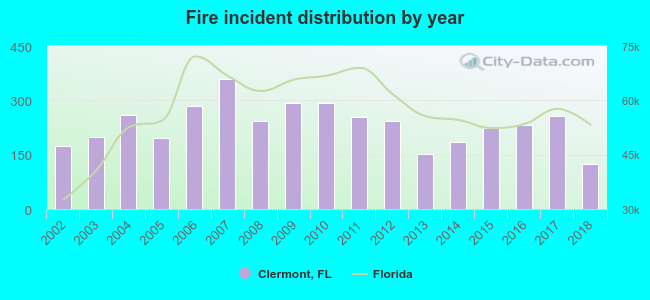 Based on the data from the years 2002 - 2018 the average number of fire incidents per year is 234. The highest number of reported fires - 358 took place in 2007, and the least - 123 in 2018. The data has a dropping trend.
The average number of yearly fire incidents per 10k residents in Clermont, FL compared to nearest cities:
(Note: Based on data for the last 3 years, including only cities with population 5,000 and above)
| Clermont: | 66.8 |
| Minneola: | 39.9 |
| Groveland: | 139.3 |
| Mascotte: | 58.0 |
| Winter Garden: | 38.1 |
| Ocoee: | 36.9 |
| Apopka: | 42.1 |
| Tavares: | 64.1 |
| Mount Dora: | 58.9 |
 The median response time based on all reported fire incidents is 7 minutes. This is close to the state median value.
The median response time in Clermont, FL compared to nearest cities:
(Note: Based on data for all years, including only cities with at least 500 fire incidents)
| Clermont: | 7 minutes |
| Minneola: | 7 minutes |
| Groveland: | 8 minutes |
| Winter Garden: | 6 minutes |
| Ocoee: | 6 minutes |
| Apopka: | 5 minutes |
| Tavares: | 6 minutes |
| Mount Dora: | 6 minutes |
| Webster: | 10 minutes |
 According to the data from the years 2002 - 2018 the average number of fire-related yearly deaths is 0. The highest number of deaths - 1 took place in 2003, and the lowest - 0 in 2002. The data has a constant trend.
The average number of deaths per 1,000 fires is 2. This indicator was the highest - 5 in 2014, and the lowest 0 in 2002. The trend for fatalities per 1,000 fire incidents is constant. Compared to the Florida value the number of fatalities per 1,000 fires is about the same.
According to the data from the years 2002 - 2018 the average number of fire-related yearly deaths is 0. The highest number of deaths - 1 took place in 2003, and the lowest - 0 in 2002. The data has a constant trend.
The average number of deaths per 1,000 fires is 2. This indicator was the highest - 5 in 2014, and the lowest 0 in 2002. The trend for fatalities per 1,000 fire incidents is constant. Compared to the Florida value the number of fatalities per 1,000 fires is about the same.
 According to the data from the years 2002 - 2018 the average number of fire-related casualties per year is 2. The highest number of casualties - 3 took place in 2007, and the lowest - 0 in 2003. The data has a constant trend.
The average number of casualties per 1,000 fire incidents is 7. This indicator was the highest - 16 in 2014, and the lowest 0 in 2003. The trend for casualties per 1,000 fires is increasing. Compared to the Florida value the number of injuries per 1,000 fires is lower.
According to the data from the years 2002 - 2018 the average number of fire-related casualties per year is 2. The highest number of casualties - 3 took place in 2007, and the lowest - 0 in 2003. The data has a constant trend.
The average number of casualties per 1,000 fire incidents is 7. This indicator was the highest - 16 in 2014, and the lowest 0 in 2003. The trend for casualties per 1,000 fires is increasing. Compared to the Florida value the number of injuries per 1,000 fires is lower.Casualties per 1,000 incidents in Clermont, FL compared to nearest cities:
(Note: Based on data for all years, including only cities with at least 500 fire incidents)
| Clermont: | 6.8 |
| Minneola: | 3.6 |
| Groveland: | 3.8 |
| Winter Garden: | 9.0 |
| Ocoee: | 2.6 |
| Apopka: | 11.3 |
| Tavares: | 2.5 |
| Mount Dora: | 11.7 |
| Webster: | 9.8 |
 26.8% incidents where reported in the morning and 73.2% in the evening. The most fires (15.7%) took place on Saturday, and the least (13.5%) on Tuesday.
 According to the 3,971 incident reports from years 2002 - 2018 most fires (11.4%) took place during March, and the least (5.5%) in September.
 Out of all 48,337 cases reported during the years 2002 - 2018, the most belonged to the categories: Rescue & EMS (59.0%), Good Intent Call (10.7%), and Hazardous Condition (9.1%).
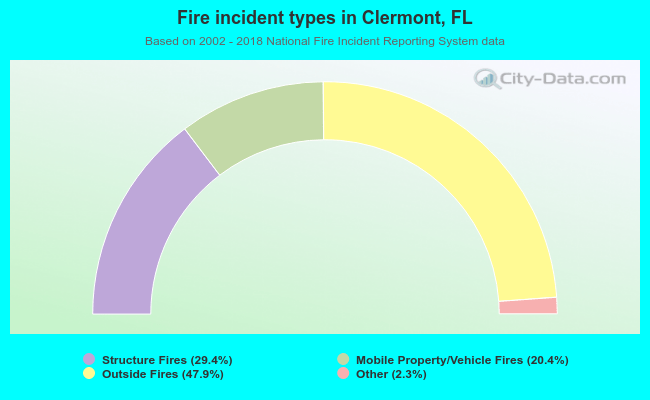 When looking into fire subcategories, the most reports belonged to: Outside Fires (47.9%), and Structure Fires (29.4%).