Clinton: Fire Incidents, Maryland (MD)
Where are fire incidents reported in Clinton, MD
Something went wrong! Please refresh the page.
| Fire incidents reported | |
|---|---|
| Sreet name | Count |
| BRANCH AVE | 52 |
| PISCATAWAY RD | 44 |
| WOODYARD RD | 40 |
| OLD BRANCH AVE | 38 |
| NB BRANCH AVE | 26 |
| OLD ALEXANDRIA FERRY RD | 24 |
| SURRATTS RD | 22 |
| THRIFT RD | 20 |
| COVENTRY WAY | 18 |
| BRANDYWINE RD | 16 |
| DANGERFIELD RD | 14 |
| KIRBY RD | 14 |
| SB BRANCH AVE | 14 |
| TEMPLE HILL RD | 14 |
| BELLEFONTE LN | 12 |
| OGDEN DR | 12 |
| PISCATAWAY ROAD | 12 |
| ACCOLADE DR | 10 |
| BURCH HILL RD | 10 |
| CHELTENHAM AVE | 10 |
| FOX RUN | 10 |
| MALCOLM RD | 10 |
| PINEWOOD DR | 10 |
| SPRINGBROOK LN | 10 |
| TIPPETT RD | 10 |
| WILLOW WAY | 10 |
| EAST BONIWOOD TURN | 8 |
| GWYNNDALE DR | 8 |
| MARY CATHERINE DR | 8 |
| PLATA ST | 8 |
| Other | 120 |
2004 - 2018 National Fire Incident Reporting System (NFIRS) incidents
- Incident types reported to NFIRS in Clinton, MD
- 3,99460.6%Rescue & EMS
- 6419.7%Service Call
- 6349.6%Fire
- 5568.4%False Alarm
- 4146.3%Hazardous Condition
- 3315.0%Good Intent Call
- 160.2%Special Incident
- Fire incident types reported to NFIRS in Clinton, MD
- 27242.9%Structure Fires
- 15324.1%Mobile Property/Vehicle Fires
- 11117.5%Other
- 9815.5%Outside Fires
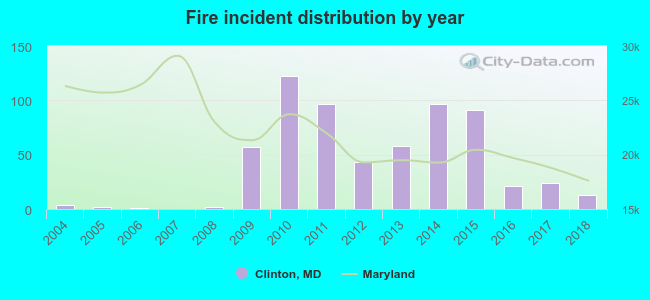 Based on the data from the years 2004 - 2018 the average number of fires per year is 42. The highest number of reported fire incidents - 122 took place in 2010, and the least - 0 in 2007. The data has a growing trend.
The average number of yearly fire incidents per 10k residents in Clinton, MD compared to nearest cities:
(Note: Based on data for the last 3 years, including only cities with population 5,000 and above)
| Clinton: | 5.4 |
| Temple Hills: | 31.8 |
| Brandywine: | 86.3 |
| Oxon Hill: | 12.8 |
| Suitland: | 9.0 |
| Fort Washington: | 12.4 |
| District Heights: | 43.7 |
| Waldorf: | 63.0 |
| Accokeek: | 30.3 |
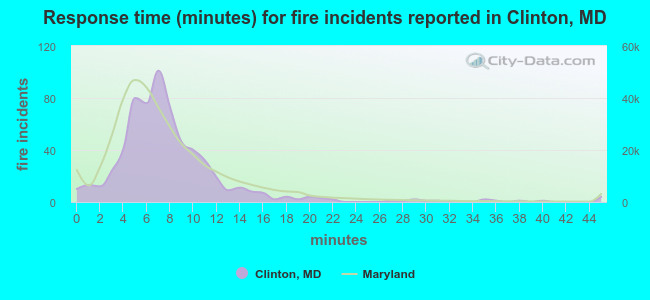 The median response time based on all reported fire incidents is 7 minutes. This is close to the Maryland median value.
The median response time in Clinton, MD compared to nearest cities:
(Note: Based on data for all years, including only cities with at least 500 fire incidents)
| Clinton: | 7 minutes |
| Brandywine: | 10 minutes |
| Oxon Hill: | 7 minutes |
| Suitland: | 6 minutes |
| Fort Washington: | 8 minutes |
| Waldorf: | 6 minutes |
| Upper Marlboro: | 9 minutes |
| Largo: | 7 minutes |
| Accokeek: | 9 minutes |
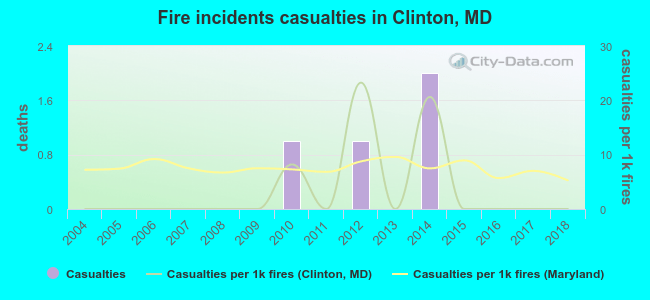 Based on the reports from the years 2004 - 2018 the average number of fire-related yearly casualties is 0. The highest number of reported casualties - 2 took place in 2014, and the lowest - 0 in 2004. The data has a constant trend.
The average number of injuries per 1,000 fire incidents is 3. This indicator was the highest - 23 in 2012, and the lowest 0 in 2004. The trend for injuries per 1,000 incidents is constant. Compared to the state value the number of injuries per 1,000 fires is lower.
Based on the reports from the years 2004 - 2018 the average number of fire-related yearly casualties is 0. The highest number of reported casualties - 2 took place in 2014, and the lowest - 0 in 2004. The data has a constant trend.
The average number of injuries per 1,000 fire incidents is 3. This indicator was the highest - 23 in 2012, and the lowest 0 in 2004. The trend for injuries per 1,000 incidents is constant. Compared to the state value the number of injuries per 1,000 fires is lower.Casualties per 1,000 incidents in Clinton, MD compared to nearest cities:
(Note: Based on data for all years, including only cities with at least 500 fire incidents)
| Clinton: | 6.3 |
| Brandywine: | 4.1 |
| Oxon Hill: | 9.1 |
| Suitland: | 10.0 |
| Fort Washington: | 8.6 |
| Waldorf: | 1.5 |
| Upper Marlboro: | 3.1 |
| Largo: | 7.6 |
| Accokeek: | 1.3 |
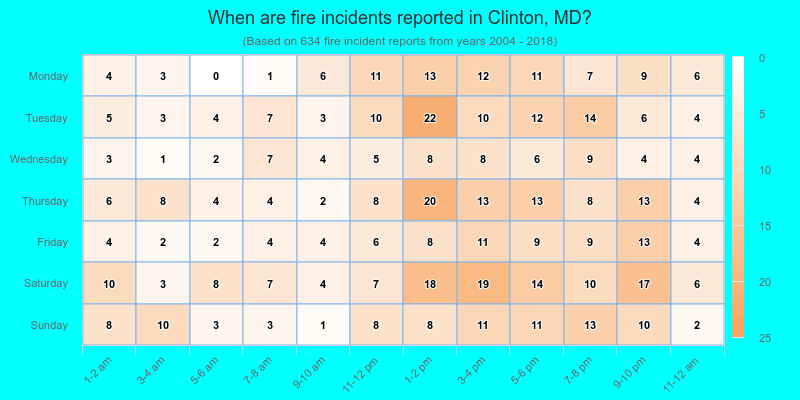
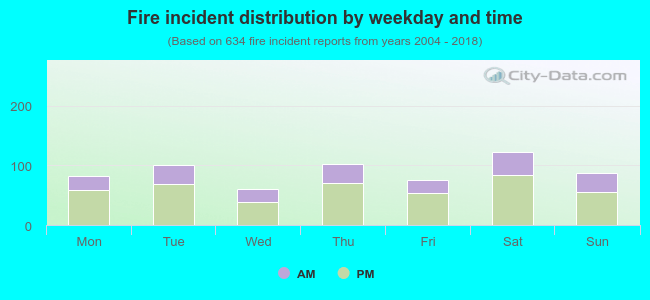 32.3% incidents where reported in the morning and 67.7% in the evening. The most fires (19.4%) took place on Saturday, and the least (9.6%) on Wednesday.
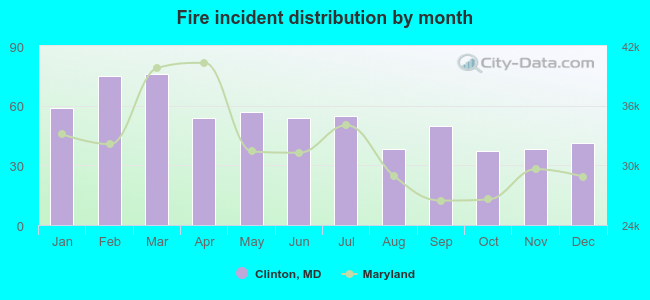 Based on the 634 fire incidents from years 2004 - 2018 most fires (12.0%) took place during March, and the least (5.8%) in October.
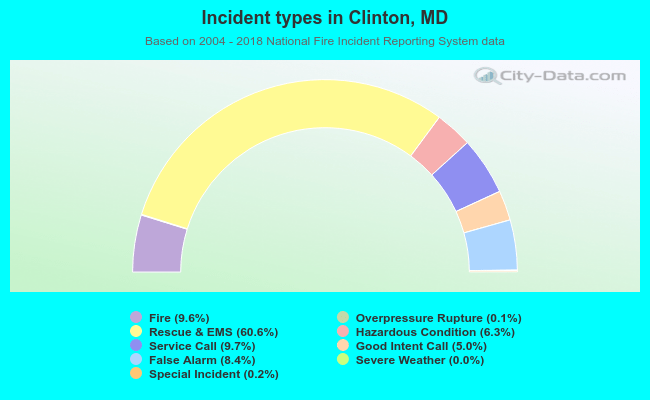 Out of all 6,595 cases reported during the years 2004 - 2018, the most belonged to the categories: Rescue & EMS (60.6%), Service Call (9.7%), and Fire (9.6%).
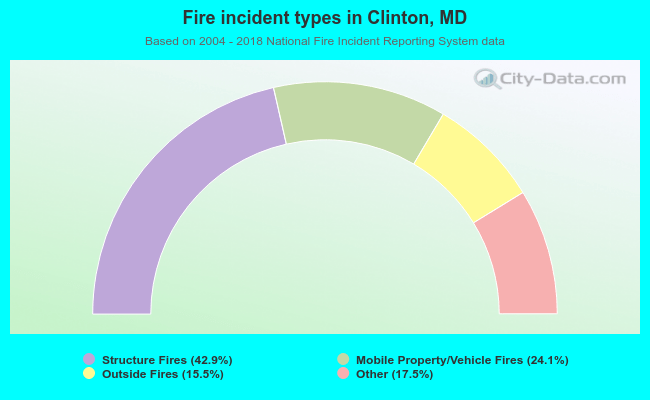 When looking into fire subcategories, the most incidents belonged to: Structure Fires (42.9%), and Mobile Property/Vehicle Fires (24.1%).