| Fire incidents reported |
|---|
| Sreet name | Count |
|---|
| COLEBROOK RIVER RD | 34 | | COLEBROOK RD | 10 | | RIVERTON RD | 10 | | BUNNELL ST | 6 | | COLEBROOK RD | 6 | | ENO HILL RD | 6 | | FLAGG HILL RD | 6 | | OLD COLEBROOK RD | 6 | | PROCK HILL RD | 6 | | ROBERTSVILLE RD | 6 | | STILLMAN HILL ROADRT 182 RT | 6 | | BUNNELL STREET ST | 4 | | CHAPIN RD | 4 | | COLEBROOK RD. | 4 | | COLEBROOK RIVER RD | 4 | | COLEBROOK RIVER RD. | 4 | | COLEBROOK ROAD-RT 183 RT | 4 | | FLAGG HILL RD | 4 | | NORFOLK RD | 4 | | OLD COLEBROOK RD | 4 | | PINE RD | 4 | | PINNEY STREET ST | 4 | | PROCK HILL ROAD RD | 4 | | RT 44 RT | 4 | | SANDY BROOK ROAD | 4 |
| | | Fire incidents reported |
|---|
| Sreet name | Count |
|---|
| SHANTRY ROAD RD | 4 | | STILLMAN HILL RD | 4 | | 182 RT | 2 | | 75 OLD COLEBROOK RD | 2 | | BEECH HILL RD | 2 | | BEECH HILL RD. | 2 | | BUNNELL | 2 | | BUNNELL ST. | 2 | | CAMPBELL RD RD | 2 | | CENTER ST | 2 | | CHAPIN RD | 2 | | CHAPIN RD. | 2 | | CHAPIN ROAD RD | 2 | | CHURCH HILL ROAD RD | 2 | | COBB CITY ROAD RD | 2 | | COLBROOK RVER | 2 | | COLEBOOK ROAD | 2 | | COLEBROOK ROAD | 2 | | CREAMERY RD | 2 | | DEER HILL RD | 2 | | DEER HILL ROAD RD | 2 | | ENO HILL RD | 2 | | FLAG HILL RD | 2 | | FLAG HILL RD. | 2 | | |
|
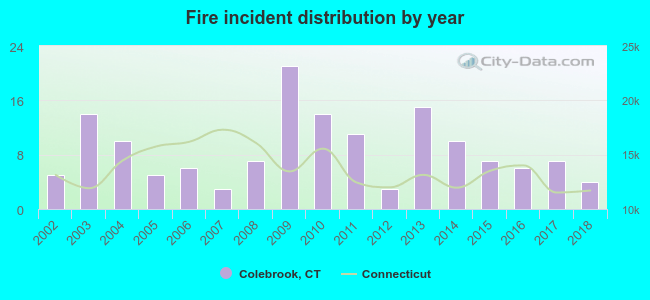 Based on the data from the years 2002 - 2018 the average number of fires per year is 9. The highest number of fires - 21 took place in 2009, and the least - 3 in 2007. The data has a decreasing trend.
 40.5% incidents where reported in the morning and 59.5% in the evening. The most fires (32.4%) took place on Friday, and the least (4.7%) on Saturday.
 According to the 148 fire incidents from years 2002 - 2018 most fires (12.2%) took place during April, and the least (1.4%) in September.
 Out of all 464 cases reported during the years 2002 - 2018, the most belonged to the categories: Fire (31.9%), Good Intent Call (23.7%), and Hazardous Condition (20.9%).
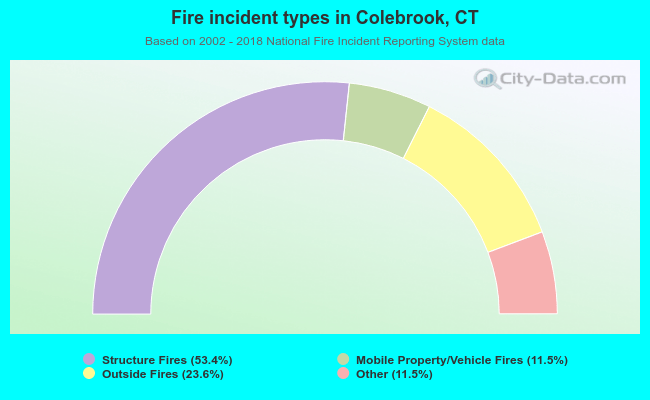 When looking into fire subcategories, the most incidents belonged to: Structure Fires (53.4%), and Outside Fires (23.6%).