Columbiana: Fire Incidents, Ohio (OH)
Where are fire incidents reported in Columbiana, OH
Something went wrong! Please refresh the page.
|
| |||||||||||||||||||||||||||||||||||||||||||||||||||||||||||||||||||||||||||||||||||||||||||||||||||||||||||||
2002 - 2018 National Fire Incident Reporting System (NFIRS) incidents
- Incident types reported to NFIRS in Columbiana, OH
- 54731.4%Rescue & EMS
- 47327.2%Fire
- 33019.0%Hazardous Condition
- 19811.4%False Alarm
- 1327.6%Service Call
- 432.5%Good Intent Call
- 90.5%Severe Weather
- 70.4%Special Incident
- 20.1%Overpressure Rupture
- Fire incident types reported to NFIRS in Columbiana, OH
- 21645.7%Structure Fires
- 16534.9%Outside Fires
- 9019.0%Mobile Property/Vehicle Fires
- 20.4%Other
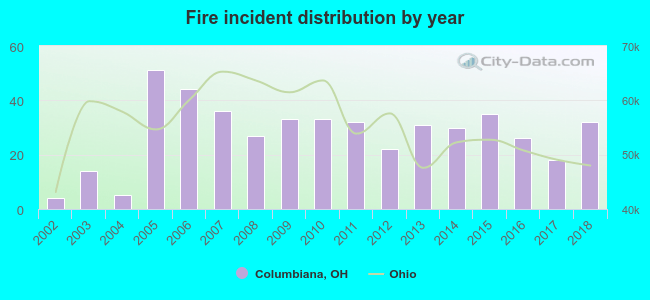 According to the data from the years 2002 - 2018 the average number of fire incidents per year is 28. The highest number of fires - 51 took place in 2005, and the least - 4 in 2002. The data has an increasing trend.
The average number of yearly fire incidents per 10k residents in Columbiana, OH compared to nearest cities:
(Note: Based on data for the last 3 years, including only cities with population 5,000 and above)
| Columbiana: | 40.0 |
| Salem: | 86.3 |
| Boardman: | 20.4 |
| Canfield: | 35.6 |
| Struthers: | 33.2 |
| Campbell: | 88.4 |
| Austintown: | 36.3 |
| Youngstown: | 89.8 |
| East Liverpool: | 128.8 |

 Based on the data from the years 2002 - 2018 the average number of fire-related yearly deaths is 0. The highest number of deaths - 1 took place in 2005, and the lowest - 0 in 2002. The data has a constant trend.
 34.9% incidents where reported in the morning and 65.1% in the evening. The most fires (18.2%) took place on Saturday, and the least (10.6%) on Monday.
 According to the 473 fire incidents from years 2002 - 2018 most fires (15.4%) took place during April, and the least (4.9%) in June.
 Out of all 1,741 cases reported during the years 2002 - 2018, the most belonged to the categories: Rescue & EMS (31.4%), Fire (27.2%), and Hazardous Condition (19.0%).
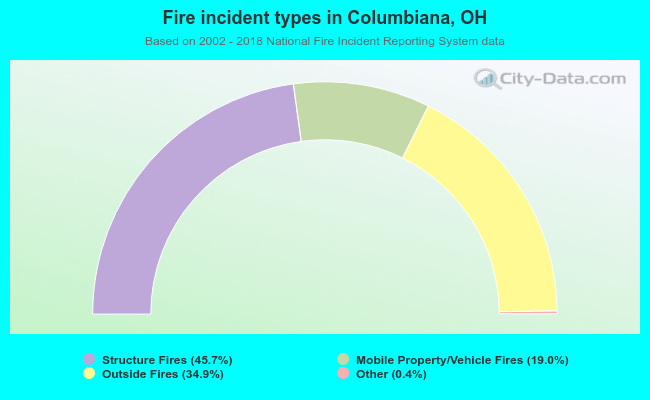 When looking into fire subcategories, the most incidents belonged to: Structure Fires (45.7%), and Outside Fires (34.9%).