Conesville: Fire Incidents, Ohio (OH)
Where are fire incidents reported in Conesville, OH
Something went wrong! Please refresh the page.
|
| |||||||||||||||||||||||||||||||||||||||||||||||||||||||||||||||||||||||||||||||||||||||||||||||||||||||||
2002 - 2018 National Fire Incident Reporting System (NFIRS) incidents
- Incident types reported to NFIRS in Conesville, OH
- 11142.4%Fire
- 7829.8%Hazardous Condition
- 4416.8%Rescue & EMS
- 155.7%Good Intent Call
- 62.3%Service Call
- 51.9%Overpressure Rupture
- 20.8%False Alarm
- 10.4%Special Incident
- Fire incident types reported to NFIRS in Conesville, OH
- 6760.4%Structure Fires
- 3329.7%Outside Fires
- 119.9%Mobile Property/Vehicle Fires
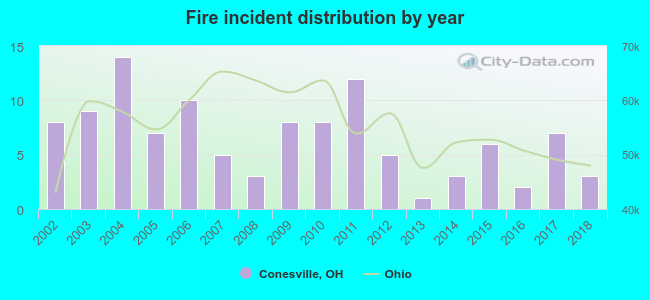 According to the data from the years 2002 - 2018 the average number of fires per year is 7. The highest number of fires - 14 took place in 2004, and the least - 1 in 2013. The data has a decreasing trend.
 29.7% incidents where reported in the morning and 70.3% in the evening. The most fires (26.1%) took place on Saturday, and the least (9.9%) on Wednesday.
 According to the 111 fire incidents from years 2002 - 2018 most fires (16.2%) took place during January, and the least (3.6%) in October.
 Out of all 262 cases reported during the years 2002 - 2018, the most belonged to the categories: Fire (42.4%), Hazardous Condition (29.8%), and Rescue & EMS (16.8%).
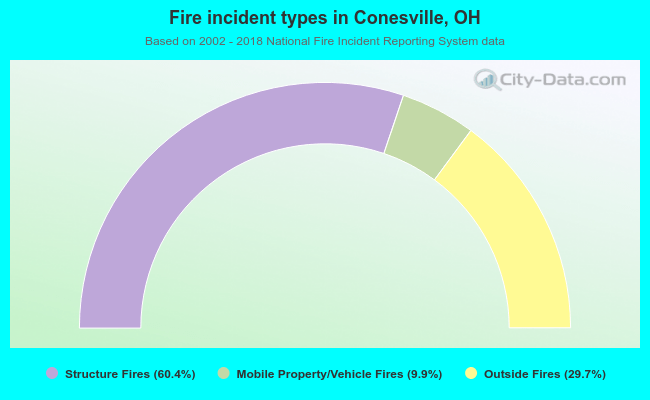 When looking into fire subcategories, the most incidents belonged to: Structure Fires (60.4%), and Outside Fires (29.7%).