Conway: Fire Incidents, New Hampshire (NH)
Where are fire incidents reported in Conway, NH
Something went wrong! Please refresh the page.
|
| |||||||||||||||||||||||||||||||||||||||||||||||||||||||||||||||||||||||||||||||||||||||||||||||||||||||||||||
2005 - 2018 National Fire Incident Reporting System (NFIRS) incidents
- Incident types reported to NFIRS in Conway, NH
- 2,43057.9%Rescue & EMS
- 68616.3%Hazardous Condition
- 3177.6%False Alarm
- 3007.1%Fire
- 2937.0%Service Call
- 1353.2%Good Intent Call
- 260.6%Severe Weather
- 50.1%Overpressure Rupture
- Fire incident types reported to NFIRS in Conway, NH
- 20468.0%Structure Fires
- 6622.0%Outside Fires
- 289.3%Mobile Property/Vehicle Fires
- 20.7%Other
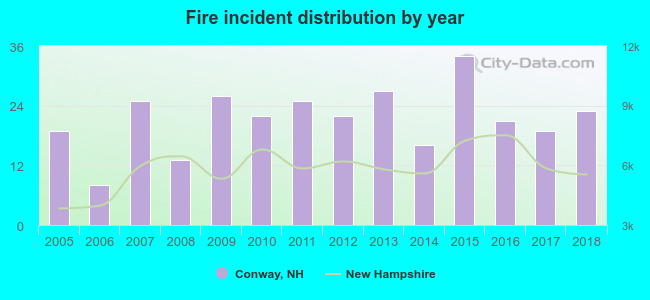 According to the data from the years 2005 - 2018 the average number of fire incidents per year is 21. The highest number of reported fires - 34 took place in 2015, and the least - 8 in 2006. The data has a growing trend.
 According to the data from the years 2005 - 2018 the average number of fire-related casualties per year is 1. The highest number of reported injuries - 2 took place in 2010, and the lowest - 0 in 2005. The data has a growing trend.
 36.3% incidents where reported in the morning and 63.7% in the evening. The most fires (17.0%) took place on Tuesday, and the least (12.7%) on Friday.
 According to the 300 incident reports from years 2005 - 2018 most fires (11.7%) took place during November, and the least (3.7%) in August.
 Out of all 4,196 cases reported during the years 2005 - 2018, the most belonged to the categories: Rescue & EMS (57.9%), Hazardous Condition (16.3%), and False Alarm (7.6%).
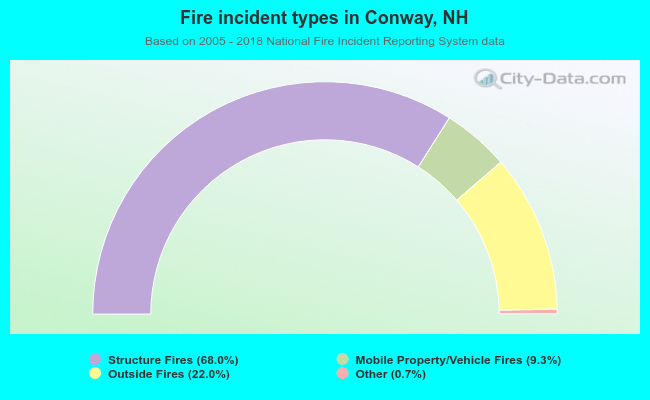 When looking into fire subcategories, the most reports belonged to: Structure Fires (68.0%), and Outside Fires (22.0%).