| Fire incidents reported |
|---|
| Sreet name | Count |
|---|
| 90TH AVE | 24 | | CONWAY SPRINGS RD | 24 | | 80TH AVE | 20 | | SPRING | 18 | | 70TH AVE | 12 | | CALDWELL | 12 | | CONWAY SPRINGS CONWAY TWP RD | 12 | | 70TH AVE | 10 | | 90TH CONWAY TWSP AVE | 10 | | 90TH SPRINGDALE TWSP AVE | 10 | | MILAN | 10 | | 110TH AVE CONWAY TWSP AVE | 8 | | 70TH AVE SUMNER TWSP AVE | 8 | | 90TH AVE | 8 | | MILAN CONWAY TWSP RD | 8 | | PARALLEL | 8 | | RYAN CONWAY TWSP RD | 8 | | SPRING ST | 8 | | 120TH AVE | 6 | | 120TH EDEN TWSP AVE | 6 | | 2ND ST | 6 | | 30TH AVE CREEK TWSP AVE | 6 | | 3RD ST | 6 | | 40TH AVE | 6 | | 5TH SPRINGDALE TWSP ST | 6 |
| | | Fire incidents reported |
|---|
| Sreet name | Count |
|---|
| 5TH ST | 6 | | 70TH AVE SPRINGDALE AVE | 6 | | 8TH | 6 | | BLUFF | 6 | | CHIKASKIA RD | 6 | | CONWAY SPRINGS SPRG TWSP RD | 6 | | MAYFIELD RD | 6 | | SPRINGDALE RD | 6 | | 100 THH AVE | 4 | | 100TH EDEN TOWNSHIP AVE | 4 | | 110TH AVE | 4 | | 119TH ST | 4 | | 120TH CONWAY TWSP AVE | 4 | | 130TH AVE | 4 | | 2ND | 4 | | 30TH AVE | 4 | | 3RD | 4 | | 40TH AVE | 4 | | 50TH AVE | 4 | | 5TH | 4 | | 5TH ST | 4 | | 60TH SPRINGDALE TWSP AVE | 4 | | 90TH CREEK TWSP AVE | 4 | | ANSON RD | 4 | | |
|
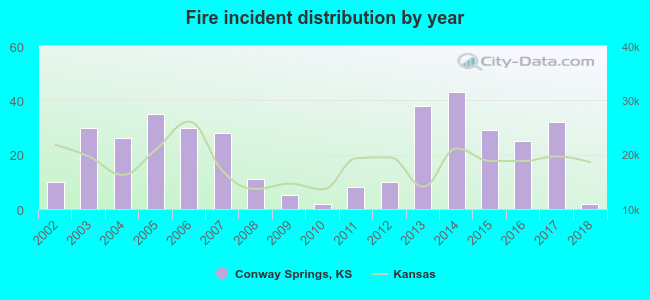 According to the data from the years 2002 - 2018 the average number of fires per year is 21. The highest number of fire incidents - 43 took place in 2014, and the least - 2 in 2010. The data has a declining trend.
 25.8% incidents where reported in the morning and 74.2% in the evening. The most fires (17.0%) took place on Wednesday, and the least (11.8%) on Friday.
 Based on the 364 reports from years 2002 - 2018 most fires (15.4%) took place during March, and the least (3.3%) in May.
 Out of all 895 cases reported during the years 2002 - 2018, the most belonged to the categories: Fire (40.7%), Rescue & EMS (29.8%), and Hazardous Condition (17.2%).
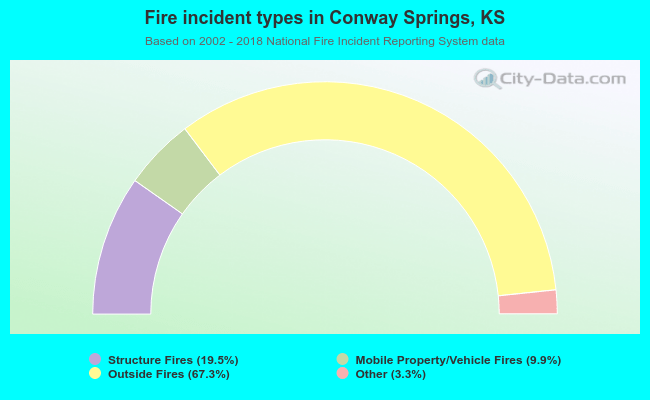 When looking into fire subcategories, the most reports belonged to: Outside Fires (67.3%), and Structure Fires (19.5%).