| Fire incidents reported |
|---|
| Sreet name | Count |
|---|
| 13019 HWY 41A | 6 | | HOUSEBRIDGE RD | 6 | | 136 8TH STREET | 4 | | 15492 HWY 41A | 4 | | 2054 WILSON STATION RD | 4 | | 3204 HWY 266 | 4 | | 3931 HWY 266 | 4 | | 5689 HOUSEBRIDGE RD | 4 | | 5835 EBLEN HANCOCK RD. | 4 | | 6932 HWY 145 | 4 | | HWY 41 A | 4 | | JOHN TAPP ROAD | 4 | | 10108 O'NAN LANE | 2 | | 10526 HWY 60 W | 2 | | 10526 HWY 60 WEST | 2 | | 10697 HWY 60 W | 2 | | 10697 US HWY 60W | 2 | | 11215 US HWY 60 W | 2 | | 120 MAIN STREET | 2 | | 12276 HWY 60 W. | 2 | | 12480 US HWY 41A | 2 | | 12687 HWY 41 A | 2 | | 12759 HWY 359 | 2 | | 130 MAIN ST | 2 | | 13000 BLOCK 60WEST | 2 |
| | | Fire incidents reported |
|---|
| Sreet name | Count |
|---|
| 13068 HWY 41 A | 2 | | 13068 HWY 41-A | 2 | | 13547 HWY 41 A | 2 | | 136 8TH ST | 2 | | 13965 HWY 41 A | 2 | | 13965 HWY 41-A | 2 | | 14160 HWY 41-A | 2 | | 14160 HWY 41A | 2 | | 14180 HWY 41-A | 2 | | 14279 HWY 41-A | 2 | | 14358 HWY 41-A | 2 | | 14402 HWY 41A | 2 | | 14465 HWY 41-A | 2 | | 14900 HWY 41-A | 2 | | 14953 HWY 41A | 2 | | 150 BROADWAY ST | 2 | | 15008 41A | 2 | | 15152 HWY 41 A | 2 | | 15152 HWY 41-A | 2 | | 15549 HWY 41A | 2 | | 15599 HWY 41A | 2 | | 1773 WILSON STATION RD. | 2 | | 2064 WILSON STATION RD | 2 | | 207 MAIN STREET | 2 | | |
|
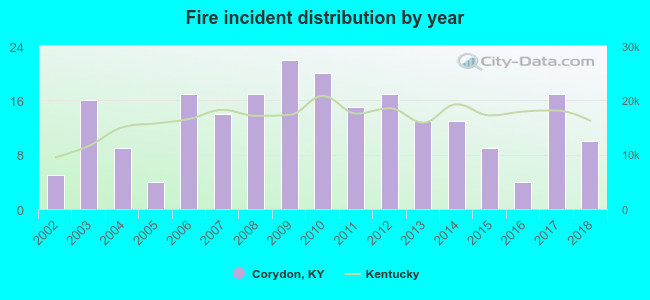 Based on the data from the years 2002 - 2018 the average number of fires per year is 13. The highest number of reported fires - 22 took place in 2009, and the least - 4 in 2005. The data has a rising trend.
 31.1% incidents where reported in the morning and 68.9% in the evening. The most fires (17.1%) took place on Saturday, and the least (11.3%) on Monday.
 According to the 222 fire incidents from years 2002 - 2018 most fires (18.0%) took place during March, and the least (2.7%) in July.
 Out of all 373 cases reported during the years 2002 - 2018, the most belonged to the categories: Fire (59.5%), Rescue & EMS (15.5%), and Overpressure Rupture (14.5%).
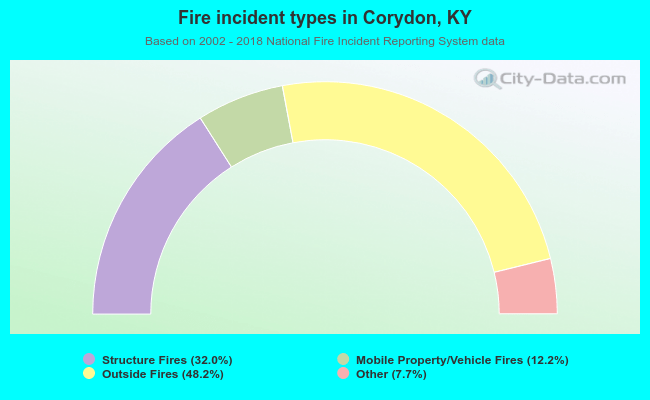 When looking into fire subcategories, the most reports belonged to: Outside Fires (48.2%), and Structure Fires (32.0%).