Crabtree: Fire Incidents, Pennsylvania (PA)
Where are fire incidents reported in Crabtree, PA
Something went wrong! Please refresh the page.
|
| |||||||||||||||||||||||||||||||||||||||||||||||||||||||||||||||||||||||||||||||||||||||||||||||||||||||||||||
2004 - 2018 National Fire Incident Reporting System (NFIRS) incidents
- Incident types reported to NFIRS in Crabtree, PA
- 20247.4%Fire
- 9121.4%Rescue & EMS
- 5613.1%Special Incident
- 235.4%Hazardous Condition
- 174.0%Service Call
- 153.5%Good Intent Call
- 143.3%False Alarm
- 81.9%Severe Weather
- Fire incident types reported to NFIRS in Crabtree, PA
- 9446.5%Other
- 6934.2%Structure Fires
- 3014.9%Outside Fires
- 94.5%Mobile Property/Vehicle Fires
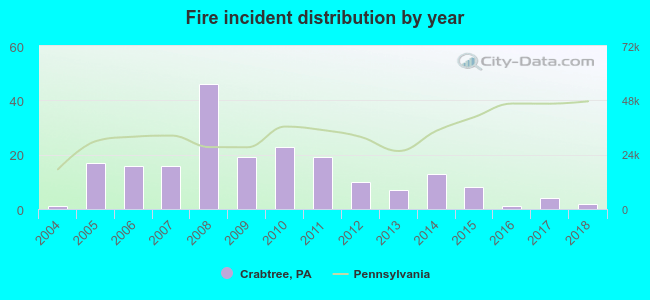 Based on the data from the years 2004 - 2018 the average number of fires per year is 13. The highest number of fire incidents - 46 took place in 2008, and the least - 1 in 2004. The data has a rising trend.
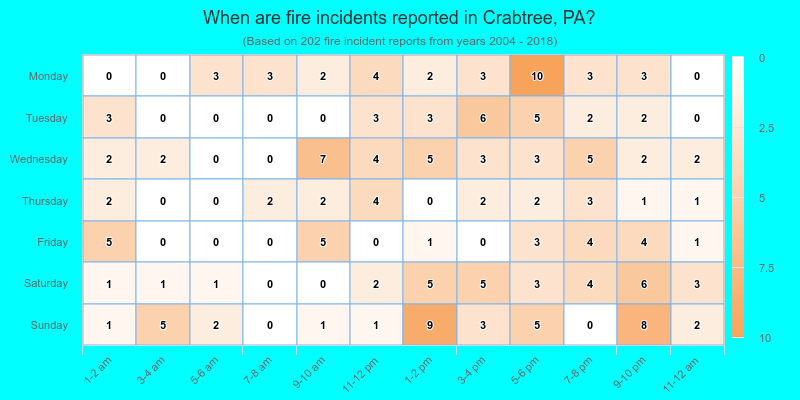
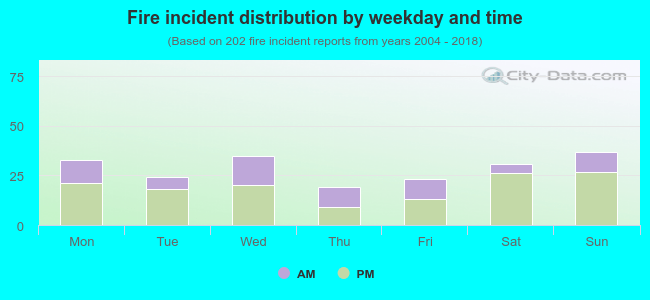 33.7% incidents where reported in the morning and 66.3% in the evening. The most fires (18.3%) took place on Sunday, and the least (9.4%) on Thursday.
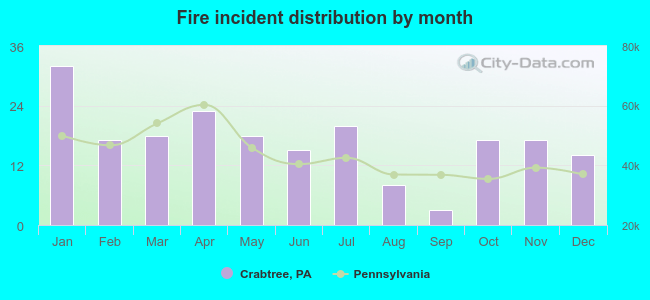 According to the 202 fire incidents from years 2004 - 2018 most fires (15.8%) took place during January, and the least (1.5%) in September.
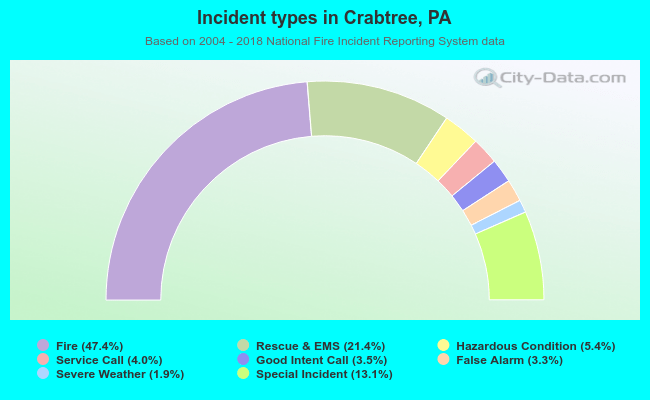 Out of all 426 cases reported during the years 2004 - 2018, the most belonged to the categories: Fire (47.4%), Overpressure Rupture (21.4%), and Severe Weather (13.1%).
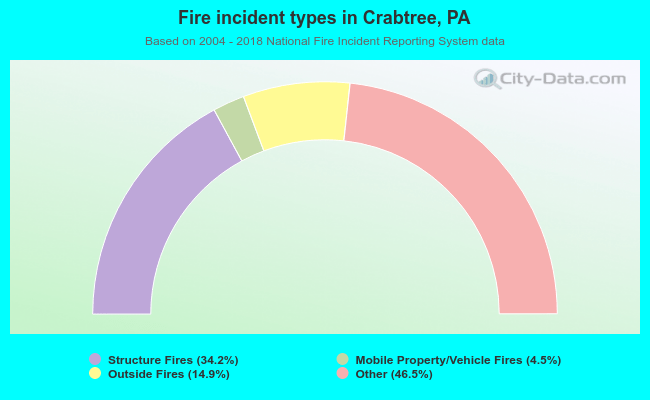 When looking into fire subcategories, the most reports belonged to: Other (46.5%), and Structure Fires (34.2%).