| Fire incidents reported |
|---|
| Sreet name | Count |
|---|
| MAIN ST | 22 | | DIXIE HWY | 18 | | BAGBY RD | 10 | | BRACHTPINER RD | 10 | | RAINBOW DR | 10 | | CARLISLE RD | 8 | | INDIAN HILL DR | 8 | | OAKWOOD DR | 8 | | 1808 VERONA MT ZION RD | 6 | | 3820 GARDNERSVILLE RD | 6 | | I75 EXPY | 6 | | LEBANON RD | 6 | | SALEM CREEK RD | 6 | | VIOLET RD | 6 | | 285 BINGHAM LN | 4 | | BRACHT-PINER RD | 4 | | CASE LN | 4 | | DERBY DR | 4 | | DOVE LN | 4 | | EAGLE CREEK DR | 4 | | GARDNERSVILLE RD | 4 | | HOPEWELL RD | 4 | | I-75 SOUTH 161 MILEMARKER | 4 | | INTERSTATE 75 | 4 | | KELLY DR | 4 |
| | | Fire incidents reported |
|---|
| Sreet name | Count |
|---|
| LANTER RD | 4 | | LEBANNONCRITTENDEN RD | 4 | | MCGEE | 4 | | MENEFEE RD | 4 | | MILLER DR | 4 | | SHERMAN-NEWTON RD | 4 | | VINCENT BLVD | 4 | | 1000 VIOLET RD. | 2 | | 101 SOUTH MAIN ST | 2 | | 1015 SHERMAN NEWTON RD | 2 | | 102 NORTH MAIN STREET | 2 | | 105 GOUGE DRIVE | 2 | | 106 AUSTIN DRIVE | 2 | | 108 SOUTH MAIN ST | 2 | | 110 PEAR TREE | 2 | | 115 CHARLES GIVIN DR. | 2 | | 115 NORTH MAIN FAMILY DOLLAR | 2 | | 120 PEAR TREE | 2 | | 1205 MANN RD. | 2 | | 121 AARONS WAY | 2 | | 127 AUSTIN DRIVE | 2 | | 130 PEARTREE LANE | 2 | | 1305 ROGERS ROAD | 2 | | 1340 LEBANON RD. | 2 | | |
|
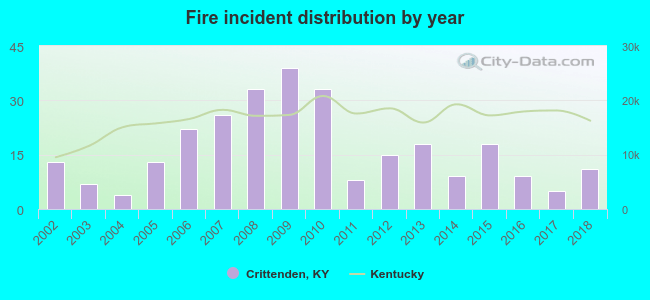 Based on the data from the years 2002 - 2018 the average number of fires per year is 17. The highest number of reported fires - 39 took place in 2009, and the least - 4 in 2004. The data has a decreasing trend.
 38.5% incidents where reported in the morning and 61.5% in the evening. The most fires (16.6%) took place on Saturday, and the least (12.4%) on Tuesday.
 According to the 283 incident reports from years 2002 - 2018 most fires (14.5%) took place during March, and the least (5.7%) in January.
 Out of all 1,244 cases reported during the years 2002 - 2018, the most belonged to the categories: Hazardous Condition (30.0%), Rescue & EMS (29.6%), and Fire (22.7%).
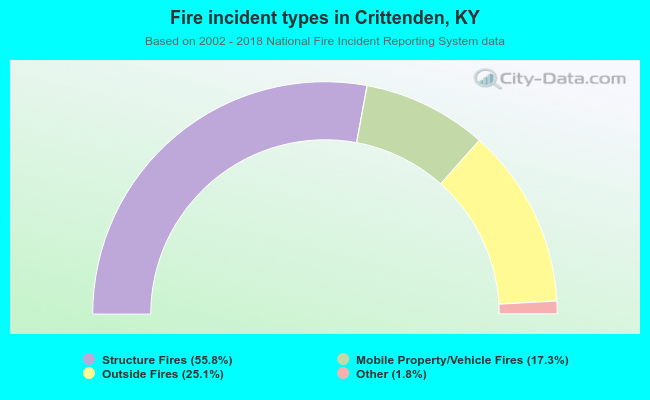 When looking into fire subcategories, the most incidents belonged to: Structure Fires (55.8%), and Outside Fires (25.1%).