Crosby: Fire Incidents, North Dakota (ND)
Where are fire incidents reported in Crosby, ND
Something went wrong! Please refresh the page.
|
| |||||||||||||||||||||||||||||||||||||||||||||||||||||||||||||||||||||||||||||||||||||||||||||||||||||||||||||
2002 - 2018 National Fire Incident Reporting System (NFIRS) incidents
- Incident types reported to NFIRS in Crosby, ND
- 11367.7%Fire
- 2313.8%False Alarm
- 116.6%Hazardous Condition
- 116.6%Good Intent Call
- 42.4%Rescue & EMS
- 31.8%Special Incident
- 21.2%Service Call
- Fire incident types reported to NFIRS in Crosby, ND
- 4842.5%Outside Fires
- 3127.4%Structure Fires
- 1916.8%Mobile Property/Vehicle Fires
- 1513.3%Other
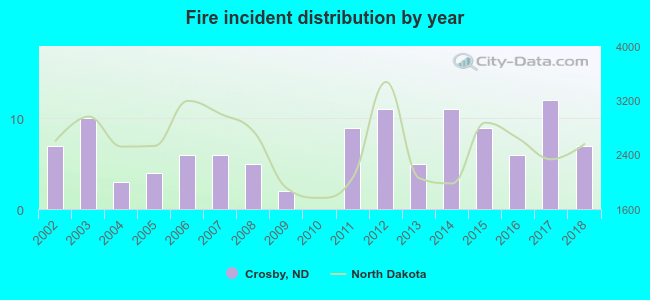 Based on the data from the years 2002 - 2018 the average number of fires per year is 7. The highest number of reported fires - 12 took place in 2017, and the least - 0 in 2010. The data has a constant trend.
 19.5% incidents where reported in the morning and 80.5% in the evening. The most fires (18.6%) took place on Tuesday, and the least (8.8%) on Monday.
 According to the 113 incident reports from years 2002 - 2018 most fires (15.9%) took place during July, and the least (0.9%) in December.
 Out of all 167 cases reported during the years 2002 - 2018, the most belonged to the categories: Fire (67.7%), Good Intent Call (13.8%), and Rescue & EMS (6.6%).
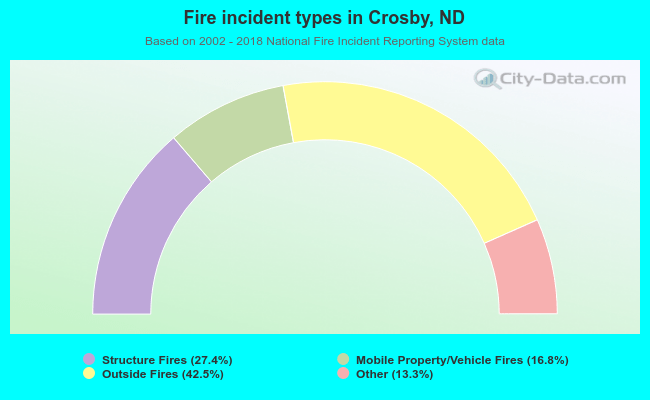 When looking into fire subcategories, the most reports belonged to: Outside Fires (42.5%), and Structure Fires (27.4%).