Cumberland: Fire Incidents, Maryland (MD)
Where are fire incidents reported in Cumberland, MD
Something went wrong! Please refresh the page.
| Fire incidents reported | |
|---|---|
| Sreet name | Count |
| BALTIMORE AVE | 152 |
| MARYLAND AVE | 114 |
| MECHANIC ST | 104 |
| GREENE ST | 84 |
| COLUMBIA ST | 82 |
| VIRGINIA AVE | 80 |
| CENTRE ST | 76 |
| OLDTOWN RD | 72 |
| BEDFORD ST | 70 |
| FREDERICK ST | 66 |
| BALTIMORE ST | 60 |
| PACA ST | 60 |
| INDUSTRIAL BLVD | 58 |
| ARCH ST | 54 |
| WILLIAMS ROAD SE | 52 |
| MCMULLEN HIGHWAY SW | 48 |
| WILLOWBROOK RD | 48 |
| GRAND AVE | 46 |
| MUTUAL AID ADDRESS | 46 |
| LIBERTY ST | 44 |
| SOMERVILLE AVE | 42 |
| MOORES HOLLOW ROAD SE | 40 |
| BRICE HOLLOW ROAD SE | 38 |
| WASHINGTON ST | 38 |
| HARRISON ST | 36 |
| MEMORIAL AVE | 36 |
| OFFUTT ST | 36 |
| PENNSYLVANIA AVE | 36 |
| MARYLAND AVENUE | 34 |
| OLDTOWN ROAD SE | 34 |
| Other | 1,974 |
2003 - 2018 National Fire Incident Reporting System (NFIRS) incidents
- Incident types reported to NFIRS in Cumberland, MD
- 5,55133.8%Rescue & EMS
- 3,76022.9%Fire
- 3,12619.0%Hazardous Condition
- 1,76910.8%Good Intent Call
- 1,0346.3%Service Call
- 1,0326.3%False Alarm
- 1070.7%Severe Weather
- 560.3%Overpressure Rupture
- Fire incident types reported to NFIRS in Cumberland, MD
- 2,25259.9%Structure Fires
- 91924.4%Outside Fires
- 52814.0%Mobile Property/Vehicle Fires
- 611.6%Other
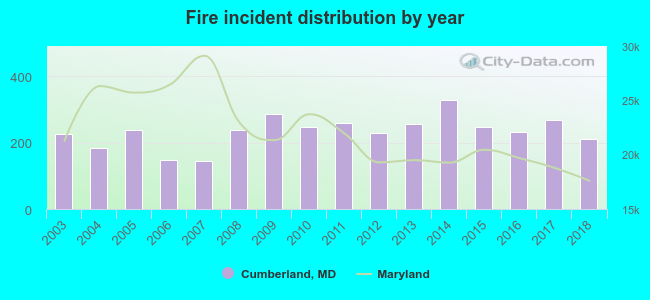 Based on the data from the years 2003 - 2018 the average number of fires per year is 234. The highest number of fires - 328 took place in 2014, and the least - 145 in 2007. The data has a declining trend.
The average number of yearly fire incidents per 10k residents in Cumberland, MD compared to nearest cities:
(Note: Based on data for the last 3 years, including only cities with population 5,000 and above)
| Cumberland: | 117.1 |
| Frostburg: | 186.2 |
 The median response time based on all reported fire incidents is 6 minutes. This is about the same as the Maryland median value.
The median response time in Cumberland, MD compared to nearest cities:
(Note: Based on data for all years, including only cities with at least 500 fire incidents)
| Cumberland: | 6 minutes |
| Frostburg: | 10 minutes |
 Based on the data from the years 2003 - 2018 the average number of fire-related yearly deaths is 0. The highest number of deaths - 2 took place in 2012, and the lowest - 0 in 2003. The data has an increasing trend.
The average number of fatalities per 1,000 fires is 2. This indicator was the highest - 9 in 2012, and the lowest 0 in 2003. The trend for deaths per 1,000 fires is growing. Compared to the state value the number of deaths per 1,000 fire incidents is similar.
Based on the data from the years 2003 - 2018 the average number of fire-related yearly deaths is 0. The highest number of deaths - 2 took place in 2012, and the lowest - 0 in 2003. The data has an increasing trend.
The average number of fatalities per 1,000 fires is 2. This indicator was the highest - 9 in 2012, and the lowest 0 in 2003. The trend for deaths per 1,000 fires is growing. Compared to the state value the number of deaths per 1,000 fire incidents is similar.Deaths per 1,000 incidents in Cumberland, MD compared to nearest cities:
(Note: Based on data for all years, including only cities with at least 2,500 fire incidents)
| Cumberland: | 1.9 |
 According to the reports from the years 2003 - 2018 the average number of fire-related yearly casualties is 4. The highest number of reported injuries - 8 took place in 2006, and the lowest - 0 in 2008. The data has a dropping trend.
The average number of injuries per 1,000 fires is 19. This indicator was the highest - 54 in 2006, and the lowest 0 in 2008. The trend for injuries per 1,000 fires is dropping. Compared to the state value the number of casualties per 1,000 fires is much higher.
According to the reports from the years 2003 - 2018 the average number of fire-related yearly casualties is 4. The highest number of reported injuries - 8 took place in 2006, and the lowest - 0 in 2008. The data has a dropping trend.
The average number of injuries per 1,000 fires is 19. This indicator was the highest - 54 in 2006, and the lowest 0 in 2008. The trend for injuries per 1,000 fires is dropping. Compared to the state value the number of casualties per 1,000 fires is much higher.Casualties per 1,000 incidents in Cumberland, MD compared to nearest cities:
(Note: Based on data for all years, including only cities with at least 500 fire incidents)
| Cumberland: | 16.8 |
| Frostburg: | 8.9 |
 32.3% incidents where reported in the morning and 67.7% in the evening. The most fires (16.0%) took place on Wednesday, and the least (12.3%) on Monday.
 According to the 3,760 reports from years 2003 - 2018 most fires (10.9%) took place during March, and the least (7.0%) in May.
 Out of all 16,443 cases reported during the years 2003 - 2018, the most belonged to the categories: Rescue & EMS (33.8%), Fire (22.9%), and Hazardous Condition (19.0%).
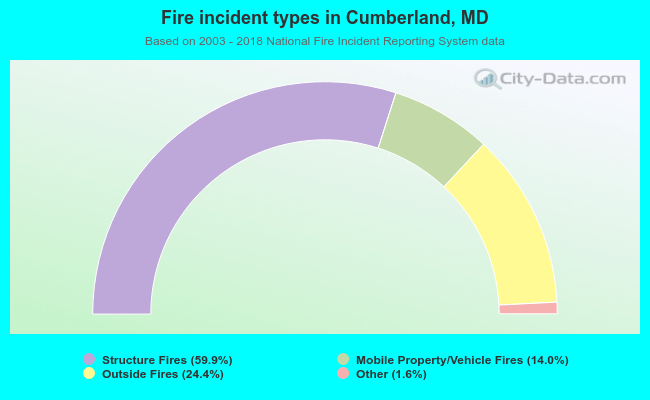 When looking into fire subcategories, the most reports belonged to: Structure Fires (59.9%), and Outside Fires (24.4%).