Dallas: Fire Incidents, Georgia (GA)
Where are fire incidents reported in Dallas, GA
Something went wrong! Please refresh the page.
|
| |||||||||||||||||||||||||||||||||||||||||||||||||||||||||||||||||||||||||||||||||||||||||||||||||||||||||||||
| Other | 1,385 | |||||||||||||||||||||||||||||||||||||||||||||||||||||||||||||||||||||||||||||||||||||||||||||||||||||||||||||
2002 - 2018 National Fire Incident Reporting System (NFIRS) incidents
- Incident types reported to NFIRS in Dallas, GA
- 20,39249.3%Rescue & EMS
- 7,06617.1%Service Call
- 5,73113.9%Good Intent Call
- 3,4838.4%Fire
- 2,9677.2%Hazardous Condition
- 1,6123.9%False Alarm
- 510.1%Severe Weather
- Fire incident types reported to NFIRS in Dallas, GA
- 1,83052.5%Outside Fires
- 1,05130.2%Structure Fires
- 50214.4%Mobile Property/Vehicle Fires
- 1002.9%Other
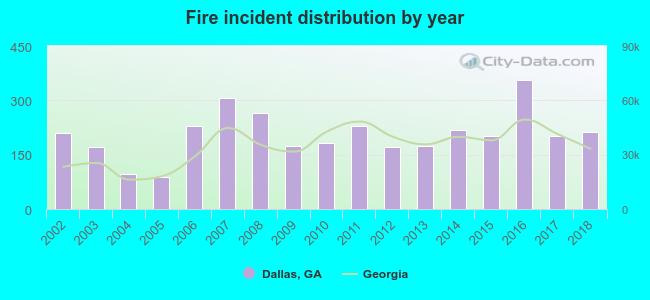 Based on the data from the years 2002 - 2018 the average number of fire incidents per year is 205. The highest number of fire incidents - 355 took place in 2016, and the least - 87 in 2005. The data has an increasing trend.
The average number of yearly fire incidents per 10k residents in Dallas, GA compared to nearest cities:
(Note: Based on data for the last 3 years, including only cities with population 5,000 and above)
| Dallas: | 203.0 |
| Powder Springs: | 65.1 |
| Winston: | 27.5 |
| Douglasville: | 66.4 |
| Lithia Springs: | 44.3 |
| Villa Rica: | 115.0 |
| Austell: | 196.1 |
| Acworth: | 85.7 |
| Kennesaw: | 49.7 |
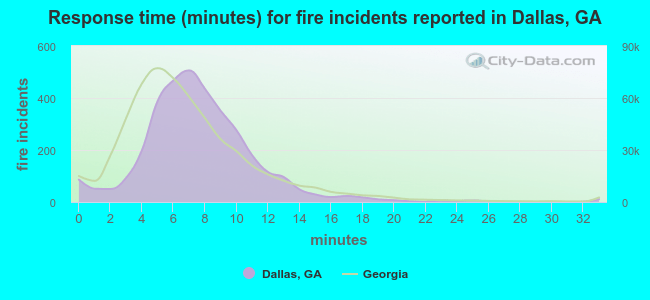 The median response time based on all reported fire incidents is 7 minutes. This is comparable to the state median value.
The median response time in Dallas, GA compared to nearest cities:
(Note: Based on data for all years, including only cities with at least 500 fire incidents)
| Dallas: | 7 minutes |
| Hiram: | 7 minutes |
| Powder Springs: | 6 minutes |
| Winston: | 7 minutes |
| Rockmart: | 8 minutes |
| Douglasville: | 6 minutes |
| Lithia Springs: | 7 minutes |
| Villa Rica: | 7 minutes |
| Austell: | 5 minutes |
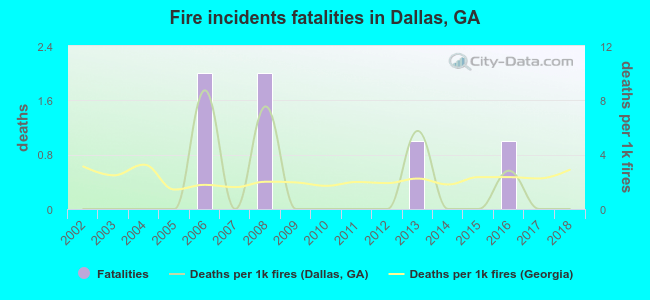 Based on the data from the years 2002 - 2018 the average number of fire-related fatalities per year is 0. The highest number of reported deaths - 2 took place in 2006, and the lowest - 0 in 2002. The data has a constant trend.
The average number of fatalities per 1,000 fires is 1. This indicator was the highest - 9 in 2006, and the lowest 0 in 2002. The trend for deaths per 1,000 incidents is constant. Compared to the Georgia value the number of fatalities per 1,000 incidents is lower.
Based on the data from the years 2002 - 2018 the average number of fire-related fatalities per year is 0. The highest number of reported deaths - 2 took place in 2006, and the lowest - 0 in 2002. The data has a constant trend.
The average number of fatalities per 1,000 fires is 1. This indicator was the highest - 9 in 2006, and the lowest 0 in 2002. The trend for deaths per 1,000 incidents is constant. Compared to the Georgia value the number of fatalities per 1,000 incidents is lower.Deaths per 1,000 incidents in Dallas, GA compared to nearest cities:
(Note: Based on data for all years, including only cities with at least 2,500 fire incidents)
| Dallas: | 1.7 |
| Douglasville: | 0.2 |
| Villa Rica: | 1.2 |
| Austell: | 1.1 |
| Acworth: | 0.7 |
| Kennesaw: | 4.7 |
| Marietta: | 2.9 |
| Cartersville: | 3.1 |
| Smyrna: | 4.7 |
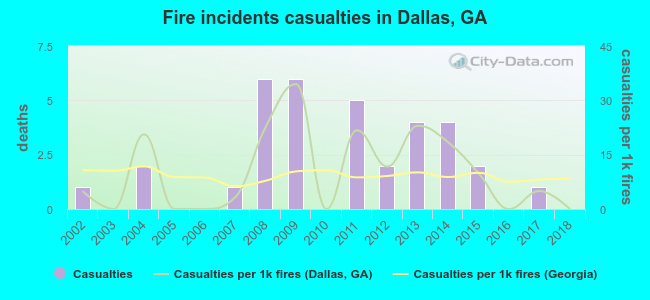 Based on the reports from the years 2002 - 2018 the average number of fire-related casualties per year is 2. The highest number of reported casualties - 6 took place in 2008, and the lowest - 0 in 2003. The data has a decreasing trend.
The average number of casualties per 1,000 fires is 10. This indicator was the highest - 34 in 2009, and the lowest 0 in 2003. The trend for injuries per 1,000 fire incidents is decreasing. Compared to the state value the number of injuries per 1,000 fires is about the same.
Based on the reports from the years 2002 - 2018 the average number of fire-related casualties per year is 2. The highest number of reported casualties - 6 took place in 2008, and the lowest - 0 in 2003. The data has a decreasing trend.
The average number of casualties per 1,000 fires is 10. This indicator was the highest - 34 in 2009, and the lowest 0 in 2003. The trend for injuries per 1,000 fire incidents is decreasing. Compared to the state value the number of injuries per 1,000 fires is about the same.Casualties per 1,000 incidents in Dallas, GA compared to nearest cities:
(Note: Based on data for all years, including only cities with at least 500 fire incidents)
| Dallas: | 9.8 |
| Hiram: | 4.2 |
| Powder Springs: | 14.3 |
| Winston: | 0.0 |
| Rockmart: | 5.8 |
| Douglasville: | 7.2 |
| Lithia Springs: | 4.0 |
| Villa Rica: | 14.6 |
| Austell: | 19.8 |
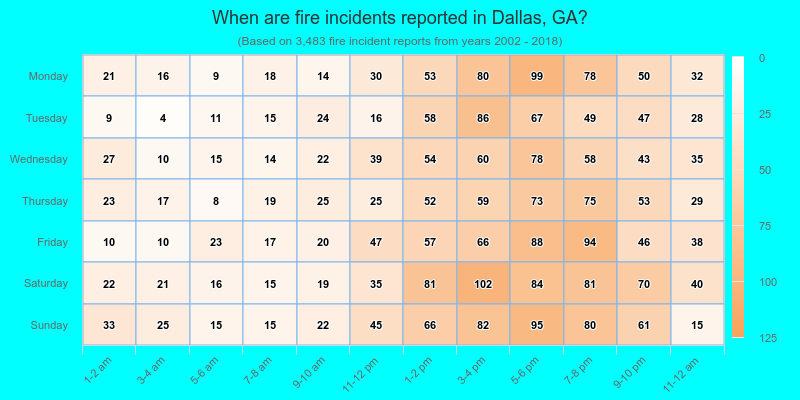
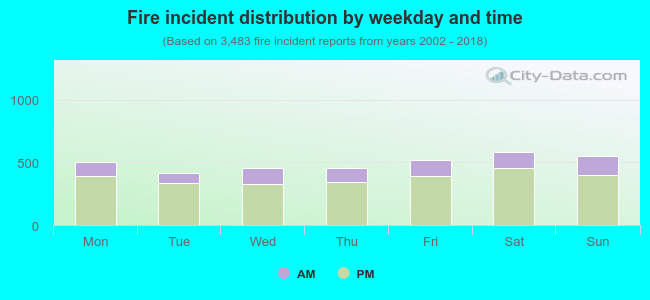 24.1% incidents where reported in the morning and 75.9% in the evening. The most fires (16.8%) took place on Saturday, and the least (11.9%) on Tuesday.
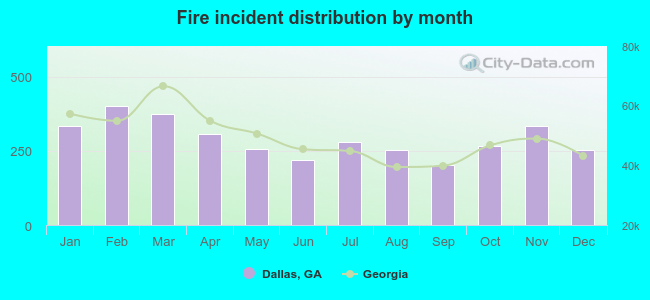 Based on the 3,483 fire incident reports from years 2002 - 2018 most fires (11.6%) took place during February, and the least (5.9%) in September.
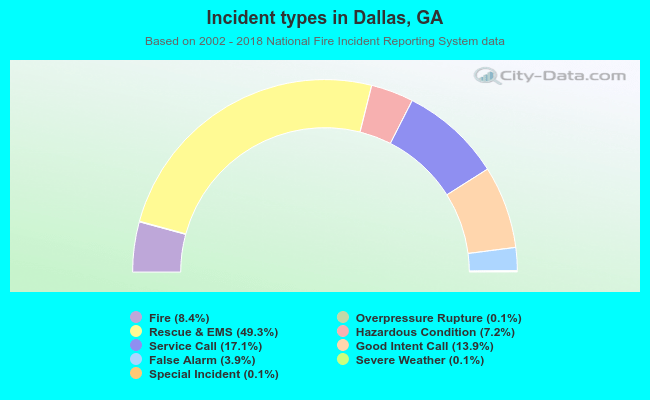 Out of all 41,370 cases reported during the years 2002 - 2018, the most belonged to the categories: Rescue & EMS (49.3%), Service Call (17.1%), and Good Intent Call (13.9%).
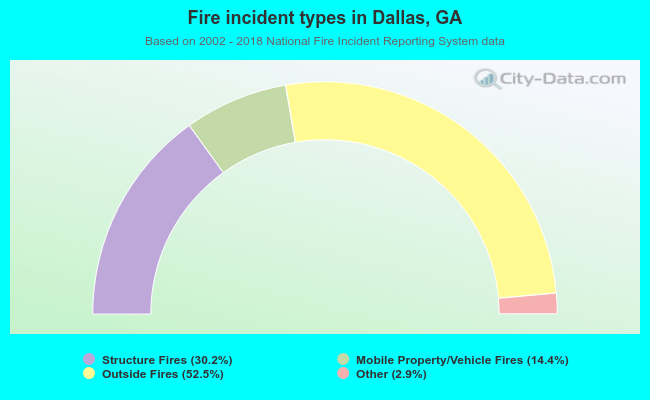 When looking into fire subcategories, the most incidents belonged to: Outside Fires (52.5%), and Structure Fires (30.2%).