| Fire incidents reported |
|---|
| Sreet name | Count |
|---|
| MAIN ST | 22 | | I 390 HWY | 12 | | WASHINGTON ST | 10 | | ELIZABETH ST | 8 | | MCCURDY RD | 8 | | STATE ROUTE 36 | 8 | | POAGS HOLE RD | 6 | | COMMERCE DR | 4 | | COTTAGE ST | 4 | | FOSTER WHEELER RD | 4 | | GREENMOUNT CT | 4 | | HORNELL RD | 4 | | JEFFERSON ST | 4 | | LIBERTY ST | 4 | | MAIN ST HWY | 4 | | MCFADDEN TRAIL | 4 | | REEDS CORNERS RD | 4 | | ROUTE 390 | 4 | | ROUTE 63 HWY | 4 | | SANDY HILL RD | 4 | | SOUTH STATE ST | 4 | | WEST AVE | 4 | | WOODSVILLE RD | 4 | | 5729 ROSS RD | 2 | | 7590 REEDS CONERS RD RD | 2 |
| | | Fire incidents reported |
|---|
| Sreet name | Count |
|---|
| 7606 GROVELAND STATION RD | 2 | | 8531 KUHN RD | 2 | | APPLINVILLE RD | 2 | | BARRETT AVE | 2 | | BIG HOLLOW RD | 2 | | CASTLE ON THE HILL | 2 | | CEMETARY ROAD | 2 | | CEMETERY RD | 2 | | CHRIISTIAN RD | 2 | | CHURCH ST | 2 | | CLARA BARTON ST | 2 | | CLARA BARTON STREET | 2 | | COUNTY 90 HWY | 2 | | COUNTY HIGHWAY 52 HWY | 2 | | COUNTY HIGHWAY 56 HWY | 2 | | CRESTWOOD CIR | 2 | | DANSVILLE MT MORRIS RD | 2 | | DEER DR | 2 | | DEER PARK DRIVE ST | 2 | | DEPOT RD | 2 | | FRANKLIN PL | 2 | | FRANKLIN ST | 2 | | FRANKLIN STREET | 2 | | GENESEE EXPRESSWAY RTE 390 NB RD | 2 | | |
|
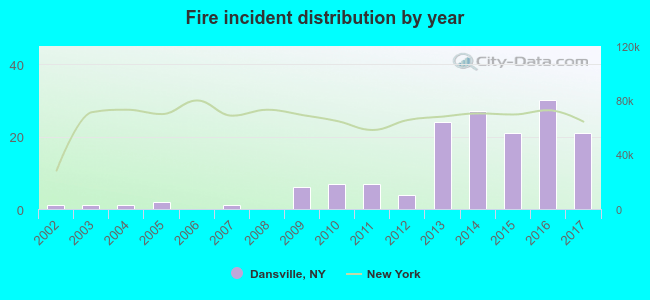 According to the data from the years 2002 - 2017 the average number of fire incidents per year is 10. The highest number of fires - 30 took place in 2016, and the least - 0 in 2006. The data has an increasing trend.
 26.8% incidents where reported in the morning and 73.2% in the evening. The most fires (18.3%) took place on Friday, and the least (11.1%) on Wednesday.
 Based on the 153 reports from years 2002 - 2017 most fires (13.7%) took place during April, and the least (4.6%) in September.
 Out of all 1,720 cases reported during the years 2002 - 2017, the most belonged to the categories: Hazardous Condition (33.7%), Rescue & EMS (23.1%), and Service Call (14.7%).
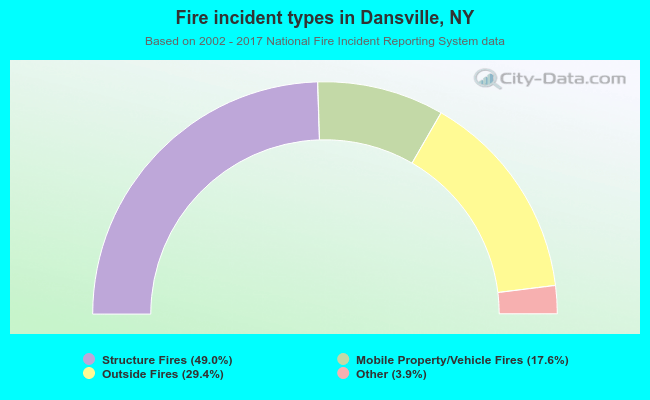 When looking into fire subcategories, the most incidents belonged to: Structure Fires (49.0%), and Outside Fires (29.4%).