Danville: Fire Incidents, Arkansas (AR)
Where are fire incidents reported in Danville, AR
Something went wrong! Please refresh the page.
|
| |||||||||||||||||||||||||||||||||||||||||||||||||||||||||||||||||||||||||||||||||||||||||||||||||||||||||||||
2002 - 2018 National Fire Incident Reporting System (NFIRS) incidents
- Incident types reported to NFIRS in Danville, AR
- 30069.1%Fire
- 4911.3%Hazardous Condition
- 358.1%Rescue & EMS
- 214.8%Service Call
- 133.0%Good Intent Call
- 71.6%False Alarm
- 71.6%Severe Weather
- 10.2%Overpressure Rupture
- 10.2%Special Incident
- Fire incident types reported to NFIRS in Danville, AR
- 15150.3%Outside Fires
- 10535.0%Structure Fires
- 3612.0%Mobile Property/Vehicle Fires
- 82.7%Other
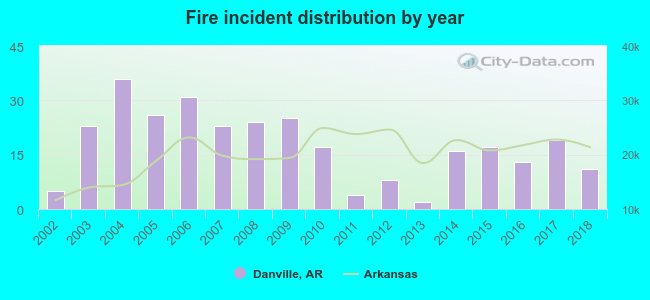 Based on the data from the years 2002 - 2018 the average number of fires per year is 18. The highest number of reported fire incidents - 36 took place in 2004, and the least - 2 in 2013. The data has a growing trend.
 According to the data from the years 2002 - 2018 the average number of fire-related yearly casualties is 0. The highest number of injuries - 2 took place in 2010, and the lowest - 0 in 2002. The data has a constant trend.
 27.3% incidents where reported in the morning and 72.7% in the evening. The most fires (17.3%) took place on Wednesday, and the least (10.3%) on Friday.
 According to the 300 fire incidents from years 2002 - 2018 most fires (15.3%) took place during January, and the least (4.3%) in October.
 Out of all 434 cases reported during the years 2002 - 2018, the most belonged to the categories: Fire (69.1%), Hazardous Condition (11.3%), and Rescue & EMS (8.1%).
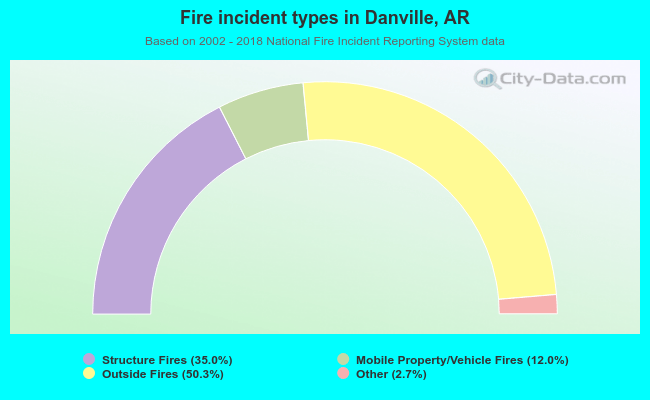 When looking into fire subcategories, the most reports belonged to: Outside Fires (50.3%), and Structure Fires (35.0%).