| Fire incidents reported |
|---|
| Sreet name | Count |
|---|
| HIGHWAY 28 | 8 | | 1312 N FRONT | 6 | | 300 SOUTH 3RD | 6 | | 915 N 4TH ST | 6 | | ALPHA RD | 6 | | CARDEN BOTTOMS | 6 | | HIGHWAY 154 | 6 | | HWY 22 E | 6 | | HWY 22 WEST | 6 | | 10106 CLEAR LANE | 4 | | 208 STATE STREET | 4 | | 410 PERRY STREET | 4 | | 514 HARRISON ST | 4 | | 607 UNION STREET | 4 | | 861 S 2ND STREET | 4 | | 903 OLD HWY 7 | 4 | | DAM ROAD | 4 | | FRONT STREET | 4 | | GAUGE RD | 4 | | HWY 22 | 4 | | HWY 27 | 4 | | HWY 7 | 4 | | WILDCAT HWL | 4 | | #1 OLD MILL CIRCLE CIR | 2 | | 100 LONE OAK DRIVE | 2 |
| | | Fire incidents reported |
|---|
| Sreet name | Count |
|---|
| 100 N 2ND ST | 2 | | 10010 COWGER LANE | 2 | | 1003 S 5TH ST | 2 | | 1003 SOUTH 5TH | 2 | | 1003 SOUTH 5TH STREET | 2 | | 1005 SOUTH 5TH STREET | 2 | | 10050 COWGER LN | 2 | | 10052 JONES MTN ROAD | 2 | | 10077 STAR LANE | 2 | | 10081 GRACE LANE | 2 | | 10096 HODGES LN | 2 | | 101 MARKET STREET | 2 | | 10101 SMITH LANE | 2 | | 10105 SCRABBLE LANE | 2 | | 10110 JACKSON LN | 2 | | 10120 PULLEN POND RD | 2 | | 1013 N 3RD | 2 | | 10150 WOLF LANE | 2 | | 10200 N NEW HOPE RD | 2 | | 10213 RIVER VIEW ACRES | 2 | | 10215 HANEY HWL | 2 | | 10221 RAINTREE LANE | 2 | | 10233 JONES LANE | 2 | | 10241 LAKESHORE LOOP | 2 | | |
|
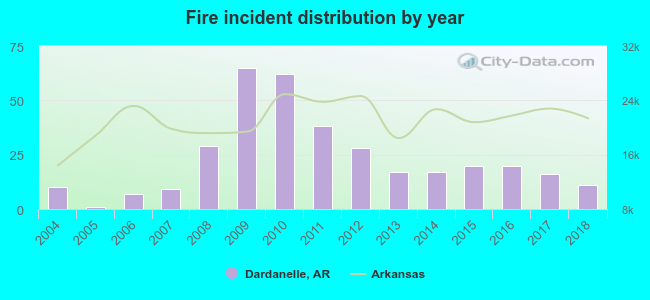 Based on the data from the years 2004 - 2018 the average number of fires per year is 23. The highest number of reported fire incidents - 65 took place in 2009, and the least - 1 in 2005. The data has a growing trend.
 30.8% incidents where reported in the morning and 69.2% in the evening. The most fires (19.1%) took place on Saturday, and the least (10.0%) on Thursday.
 According to the 351 fires from years 2004 - 2018 most fires (15.4%) took place during January, and the least (3.7%) in September.
 Out of all 487 cases reported during the years 2004 - 2018, the most belonged to the categories: Fire (72.1%), False Alarm (9.2%), and Hazardous Condition (8.2%).
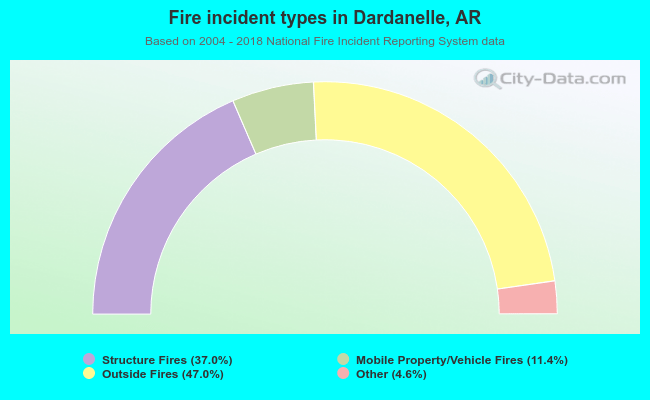 When looking into fire subcategories, the most reports belonged to: Outside Fires (47.0%), and Structure Fires (37.0%).