Del Rio: Fire Incidents, Texas (TX)
Where are fire incidents reported in Del Rio, TX
Something went wrong! Please refresh the page.
| Fire incidents reported | |
|---|---|
| Sreet name | Count |
| 90 HWY | 150 |
| VETERANS BLVD | 124 |
| VETERAN'S BLVD | 116 |
| BEDELL AVE | 68 |
| SPUR 239 | 62 |
| CANTU RD | 46 |
| GARZA ST | 44 |
| MAIN ST | 44 |
| GIBBS ST | 40 |
| GUTIERREZ ST | 40 |
| DE LA ROSA ST | 36 |
| SECOND ST | 36 |
| NINTH ST | 34 |
| CHAPOY ST | 30 |
| MARTIN ST | 30 |
| CANYON CREEK DR | 28 |
| GARFIELD ST | 28 |
| LAS VACAS ST | 28 |
| VEGA VERDE RD. | 28 |
| KINGS WAY | 26 |
| QUALIA DR | 24 |
| VIESCA ST | 24 |
| DR. FERMIN CALDERON BLVD | 22 |
| 277 HWY | 20 |
| CORTINAS ST | 20 |
| DIGNOWITY ST | 20 |
| MCLYMONT AVE | 20 |
| MEMORIAL DR | 20 |
| MOODY RANCH | 20 |
| SIXTH ST | 20 |
| Other | 1,423 |
2003 - 2018 National Fire Incident Reporting System (NFIRS) incidents
- Incident types reported to NFIRS in Del Rio, TX
- 5,18236.3%Rescue & EMS
- 2,90920.4%Hazardous Condition
- 2,67118.7%Fire
- 1,88113.2%Service Call
- 8666.1%False Alarm
- 7435.2%Good Intent Call
- 190.1%Severe Weather
- Fire incident types reported to NFIRS in Del Rio, TX
- 1,63661.3%Outside Fires
- 62223.3%Structure Fires
- 36013.5%Mobile Property/Vehicle Fires
- 532.0%Other
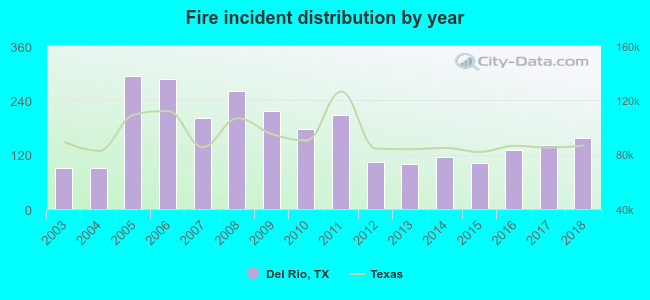 According to the data from the years 2003 - 2018 the average number of fire incidents per year is 167. The highest number of fire incidents - 294 took place in 2005, and the least - 91 in 2003. The data has a growing trend.
 The median response time based on all reported fire incidents is 5 minutes. This is lower than the Texas median value.
The median response time in Del Rio, TX compared to nearest cities:
(Note: Based on data for all years, including only cities with at least 500 fire incidents)
| Del Rio: | 5 minutes |
| Eagle Pass: | 6 minutes |
| Uvalde: | 4 minutes |
| Sonora: | 17 minutes |
| Pearsall: | 10 minutes |
| Dilley: | 13 minutes |
| Kerrville: | 6 minutes |
| Cotulla: | 13 minutes |
| Devine: | 12 minutes |
 According to the data from the years 2003 - 2018 the average number of fire-related fatalities per year is 0. The highest number of reported deaths - 2 took place in 2003, and the lowest - 0 in 2004. The data has a dropping trend.
The average number of deaths per 1,000 fire incidents is 3. This indicator was the highest - 22 in 2003, and the lowest 0 in 2004. The trend for fatalities per 1,000 fires is dropping. Compared to the Texas value the number of fatalities per 1,000 fire incidents is about the same.
According to the data from the years 2003 - 2018 the average number of fire-related fatalities per year is 0. The highest number of reported deaths - 2 took place in 2003, and the lowest - 0 in 2004. The data has a dropping trend.
The average number of deaths per 1,000 fire incidents is 3. This indicator was the highest - 22 in 2003, and the lowest 0 in 2004. The trend for fatalities per 1,000 fires is dropping. Compared to the Texas value the number of fatalities per 1,000 fire incidents is about the same.Deaths per 1,000 incidents in Del Rio, TX compared to nearest cities:
(Note: Based on data for all years, including only cities with at least 2,500 fire incidents)
| Del Rio: | 1.9 |
 According to the reports from the years 2003 - 2018 the average number of fire-related yearly casualties is 1. The highest number of reported casualties - 6 took place in 2008, and the lowest - 0 in 2004. The data has a decreasing trend.
The average number of injuries per 1,000 fires is 7. This indicator was the highest - 23 in 2008, and the lowest 0 in 2004. The trend for casualties per 1,000 fires is declining. Compared to the Texas value the number of injuries per 1,000 fires is similar.
According to the reports from the years 2003 - 2018 the average number of fire-related yearly casualties is 1. The highest number of reported casualties - 6 took place in 2008, and the lowest - 0 in 2004. The data has a decreasing trend.
The average number of injuries per 1,000 fires is 7. This indicator was the highest - 23 in 2008, and the lowest 0 in 2004. The trend for casualties per 1,000 fires is declining. Compared to the Texas value the number of injuries per 1,000 fires is similar.
 26.2% incidents where reported in the morning and 73.8% in the evening. The most fires (15.8%) took place on Friday, and the least (12.6%) on Tuesday.
 Based on the 2,671 fire incident reports from years 2003 - 2018 most fires (11.8%) took place during January, and the least (5.9%) in September.
 Out of all 14,287 cases reported during the years 2003 - 2018, the most belonged to the categories: Rescue & EMS (36.3%), Hazardous Condition (20.4%), and Fire (18.7%).
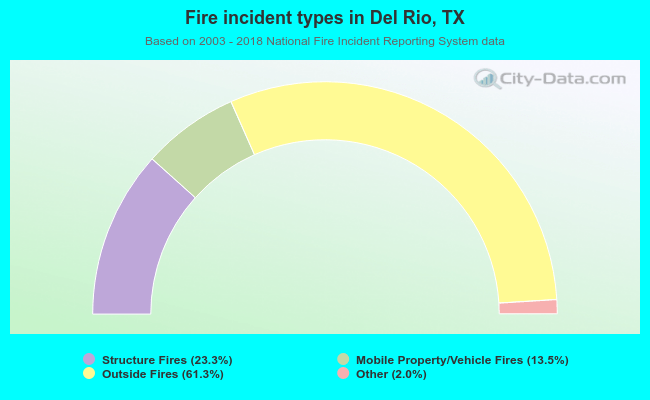 When looking into fire subcategories, the most reports belonged to: Outside Fires (61.3%), and Structure Fires (23.3%).