Diamond Bar: Fire Incidents, California (CA)
Where are fire incidents reported in Diamond Bar, CA
Something went wrong! Please refresh the page.
|
| |||||||||||||||||||||||||||||||||||||||||||||||||||||||||||||||||||||||||||||||||||||||||||||||||||||||||||||
2005 - 2018 National Fire Incident Reporting System (NFIRS) incidents
- Incident types reported to NFIRS in Diamond Bar, CA
- 6,46848.8%Rescue & EMS
- 4,01730.3%Good Intent Call
- 1,1378.6%False Alarm
- 6414.8%Fire
- 5003.8%Hazardous Condition
- 4703.5%Service Call
- 170.1%Special Incident
- Fire incident types reported to NFIRS in Diamond Bar, CA
- 28744.8%Mobile Property/Vehicle Fires
- 16926.4%Outside Fires
- 15323.9%Structure Fires
- 325.0%Other
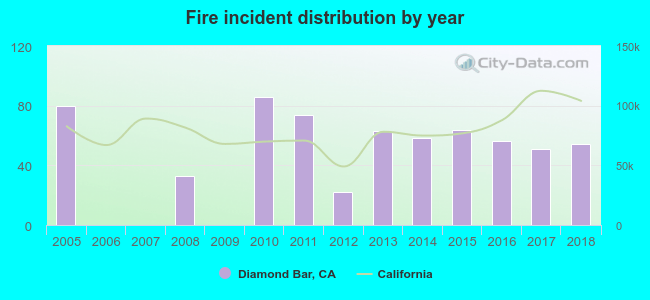 According to the data from the years 2005 - 2018 the average number of fire incidents per year is 46. The highest number of fire incidents - 86 took place in 2010, and the least - 0 in 2006. The data has a decreasing trend.
The average number of yearly fire incidents per 10k residents in Diamond Bar, CA compared to nearest cities:
(Note: Based on data for the last 3 years, including only cities with population 5,000 and above)
| Diamond Bar: | 9.5 |
| Walnut: | 8.6 |
| Rowland Heights: | 6.5 |
| Pomona: | 27.8 |
| Chino Hills: | 5.7 |
| Brea: | 14.2 |
| Valinda: | 10.2 |
| West Covina: | 5.2 |
| San Dimas: | 14.6 |
 The median response time based on all reported fire incidents is 6 minutes. This is about the same as the California median value.
The median response time in Diamond Bar, CA compared to nearest cities:
(Note: Based on data for all years, including only cities with at least 500 fire incidents)
| Diamond Bar: | 6 minutes |
| Pomona: | 5 minutes |
| West Covina: | 6 minutes |
| San Dimas: | 5 minutes |
| Covina: | 4 minutes |
| Industry: | 6 minutes |
| Chino: | 6 minutes |
| Yorba Linda: | 7 minutes |
| La Verne: | 5 minutes |
 34.8% incidents where reported in the morning and 65.2% in the evening. The most fires (16.4%) took place on Sunday, and the least (12.8%) on Thursday.
 According to the 641 fire incident reports from years 2005 - 2018 most fires (9.8%) took place during May, and the least (6.6%) in June.
 Out of all 13,265 cases reported during the years 2005 - 2018, the most belonged to the categories: Rescue & EMS (48.8%), Good Intent Call (30.3%), and False Alarm (8.6%).
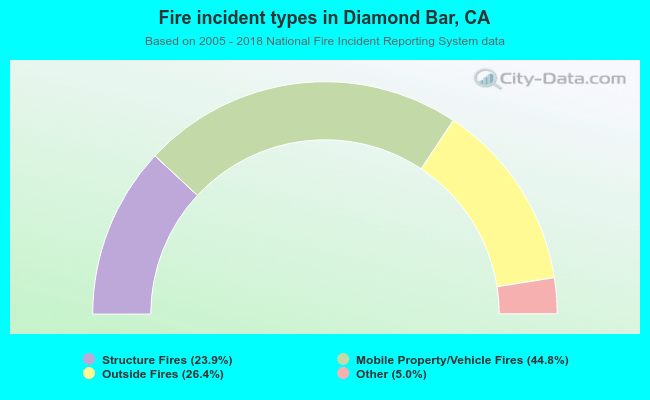 When looking into fire subcategories, the most incidents belonged to: Mobile Property/Vehicle Fires (44.8%), and Outside Fires (26.4%).