| Fire incidents reported |
|---|
| Sreet name | Count |
|---|
| STATE ROUTE 150 | 38 | | STATE ROUTE 150 RT | 36 | | STATE ROUTE 152 | 32 | | COUNTY ROAD 7 | 28 | | RHODES STREET | 24 | | SMITHFIELD STREET | 24 | | COUNTY ROAD 8 | 22 | | LIBERTY STREET ST | 18 | | TOWNSHIP ROAD 120 | 18 | | RICE STREET ST | 16 | | TOWNSHIP ROAD 104 | 16 | | MAIN STREET | 14 | | TOWNSHIP ROAD 1099 | 12 | | COLERAIN ST | 10 | | COUNTY ROAD 1 | 10 | | COSS STREET ST | 8 | | LIBERTY STREET | 8 | | MAJOR RD | 8 | | TOWNSHIP ROAD 1098 | 8 | | TOWNSHIP ROAD 114 | 8 | | TOWNSHIP ROAD 134 | 8 | | WATSON STREET ST | 8 | | COUNTY ROAD 11 | 6 | | COUNTY ROAD 15 | 6 | | COUNTY ROAD 16 | 6 |
| | | Fire incidents reported |
|---|
| Sreet name | Count |
|---|
| TOWNSHIP ROAD 1111 | 6 | | TOWNSHIP ROAD 1196 | 6 | | TOWNSHIP ROAD 1197 | 6 | | TOWNSHIP ROAD 129 RDS | 6 | | TOWNSHIP ROAD 150 RD | 6 | | TOWNSHIP ROAD 39 | 6 | | COUNTY ROAD 20 | 4 | | COUNTY ROAD 3 | 4 | | JONES ROAD | 4 | | MAIN ST. ST | 4 | | PLEASANT GROVE | 4 | | PUBLIC ROAD | 4 | | RHODES ST | 4 | | ST. RT. 150 | 4 | | STATE ROUTE 150 | 4 | | STATE ROUTE 151 | 4 | | TOWNSHIP ROAD 113 | 4 | | TOWNSHIP ROAD 119 | 4 | | TOWNSHIP ROAD 150 | 4 | | TWP HWY 112 | 4 | | TWP RD 1096 | 4 | | TWP RD 1099 | 4 | | TWP RD 120 | 4 | | 21 TWP. RD. ??1099 | 2 | | |
|
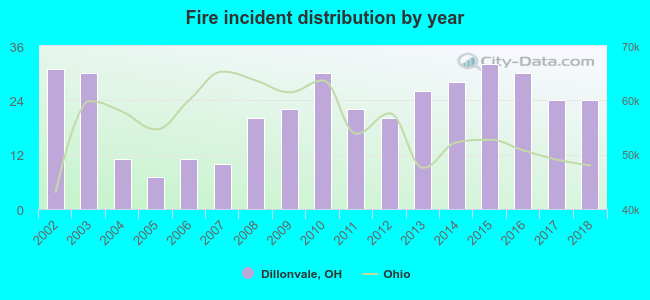 According to the data from the years 2002 - 2018 the average number of fire incidents per year is 22. The highest number of reported fires - 32 took place in 2015, and the least - 7 in 2005. The data has a declining trend.
 29.6% incidents where reported in the morning and 70.4% in the evening. The most fires (16.7%) took place on Sunday, and the least (11.6%) on Thursday.
 Based on the 378 fire incidents from years 2002 - 2018 most fires (16.1%) took place during March, and the least (5.0%) in January.
 Out of all 927 cases reported during the years 2002 - 2018, the most belonged to the categories: Fire (40.8%), Rescue & EMS (32.7%), and Service Call (8.0%).
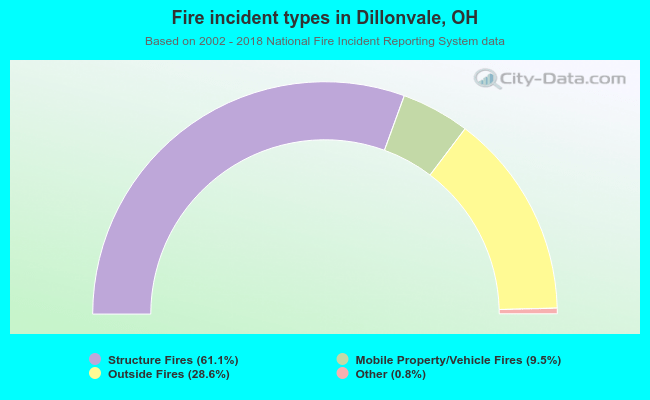 When looking into fire subcategories, the most incidents belonged to: Structure Fires (61.1%), and Outside Fires (28.6%).