| Fire incidents reported |
|---|
| Sreet name | Count |
|---|
| DUNSMUIR AVE | 130 | | INTERSTATE 5 FWY | 128 | | SACRAMENTO AVE | 48 | | SHASTA AVE | 44 | | I5 HWY | 38 | | BUTTERFLY AVE | 32 | | CRAG VIEW DR | 28 | | FIRST ST | 24 | | MOTT RD | 20 | | OAK ST | 18 | | INTERSTATE 5 HWY | 16 | | KATHERINE ST | 16 | | RIVER AVE | 16 | | SISKIYOU AVE | 12 | | UNION PACIFIC RAILROAD LOWER Y TRAK | 12 | | CASTLE AVE | 10 | | MOTT AIRPORT RD | 10 | | ROONEY LN | 10 | | FLORENCE LOOP | 8 | | PATRICIA WAY | 8 | | RAILROAD PARK RD | 8 | | SECOND ST | 8 | | VISTA ST | 8 | | CALDWELL AVE | 6 | | CASTLE ST | 6 |
| | | Fire incidents reported |
|---|
| Sreet name | Count |
|---|
| FRANCIS ST | 6 | | GILL AVE | 6 | | HART AVE | 6 | | MARION ST | 6 | | MOTT ST | 6 | | UNION PACIFIC RAILROAD LOWER TRAK | 6 | | WOOD ST | 6 | | 2ND ST | 4 | | INTERSTATE 5 N/B N/O MOTT RD FWY | 4 | | MOUNT BRADLEY RD | 4 | | OLD STAGE RD | 4 | | SCHERRER AVE | 4 | | SHASTA VIEW AVE | 4 | | UPPER SODA RD | 4 | | VERNIE ST | 4 | | VISTA DR | 4 | | ST | 2 | | 1ST AVE | 2 | | BEHIND ROD & GUN CLUB | 2 | | BEVERLY WAY | 2 | | BRADLEY WAY | 2 | | BRANSTETTER ST | 2 | | BUTTERFLY | 2 | | CASTLE AVE AVE | 2 | | |
|
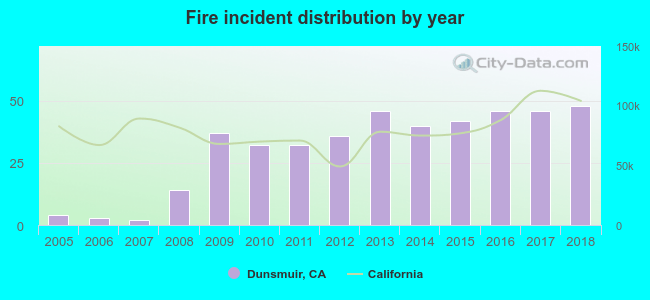 According to the data from the years 2005 - 2018 the average number of fire incidents per year is 31. The highest number of fires - 48 took place in 2018, and the least - 2 in 2007. The data has a rising trend.
 31.5% incidents where reported in the morning and 68.5% in the evening. The most fires (16.4%) took place on Saturday, and the least (10.5%) on Sunday.
 According to the 428 fires from years 2005 - 2018 most fires (12.4%) took place during August, and the least (4.2%) in February.
 Out of all 2,527 cases reported during the years 2005 - 2018, the most belonged to the categories: Overpressure Rupture (44.1%), Fire (16.9%), and Service Call (14.1%).
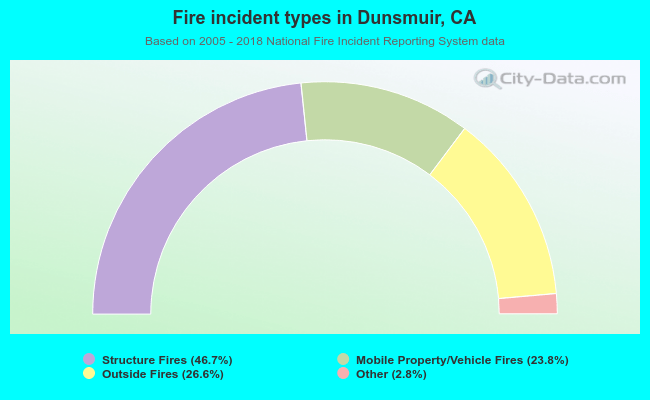 When looking into fire subcategories, the most reports belonged to: Structure Fires (46.7%), and Outside Fires (26.6%).