East Grand Forks: Fire Incidents, Minnesota (MN)
Where are fire incidents reported in East Grand Forks, MN
Something went wrong! Please refresh the page.
|
| |||||||||||||||||||||||||||||||||||||||||||||||||||||||||||||||||||||||||||||||||||||||||||||||||||||||||||||
2002 - 2018 National Fire Incident Reporting System (NFIRS) incidents
- Incident types reported to NFIRS in East Grand Forks, MN
- 3,42757.7%Rescue & EMS
- 1,25021.0%Service Call
- 4888.2%Fire
- 3696.2%Hazardous Condition
- 2434.1%False Alarm
- 1162.0%Good Intent Call
- 170.3%Overpressure Rupture
- 160.3%Special Incident
- 130.2%Severe Weather
- Fire incident types reported to NFIRS in East Grand Forks, MN
- 18938.7%Structure Fires
- 18437.7%Outside Fires
- 8417.2%Mobile Property/Vehicle Fires
- 316.4%Other
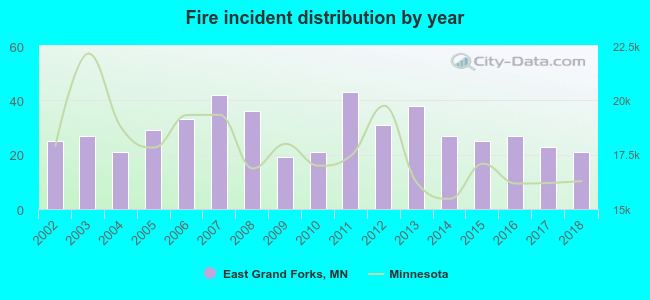 Based on the data from the years 2002 - 2018 the average number of fire incidents per year is 29. The highest number of fires - 43 took place in 2011, and the least - 19 in 2009. The data has a dropping trend.
The average number of yearly fire incidents per 10k residents in East Grand Forks, MN compared to nearest cities:
(Note: Based on data for the last 3 years, including only cities with population 5,000 and above)
| East Grand Forks: | 27.4 |
| Crookston: | 37.5 |
| Thief River Falls: | 43.9 |

 According to the reports from the years 2002 - 2018 the average number of fire-related yearly casualties is 0. The highest number of casualties - 2 took place in 2016, and the lowest - 0 in 2002. The data has a constant trend.
 36.1% incidents where reported in the morning and 63.9% in the evening. The most fires (16.0%) took place on Friday, and the least (11.5%) on Monday.
 Based on the 488 fire incidents from years 2002 - 2018 most fires (12.7%) took place during May, and the least (3.9%) in February.
 Out of all 5,939 cases reported during the years 2002 - 2018, the most belonged to the categories: Rescue & EMS (57.7%), Service Call (21.0%), and Fire (8.2%).
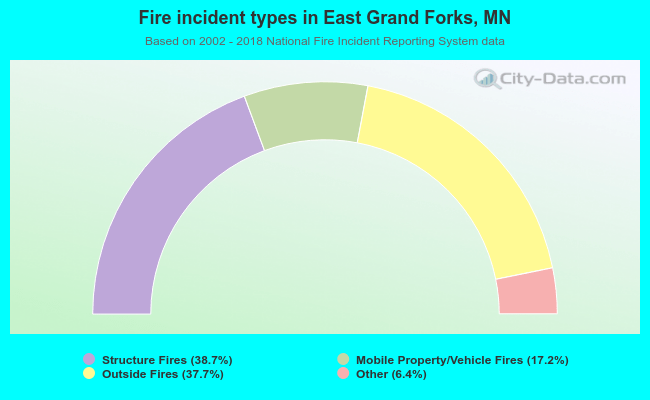 When looking into fire subcategories, the most reports belonged to: Structure Fires (38.7%), and Outside Fires (37.7%).