East Hartford: Fire Incidents, Connecticut (CT)
Where are fire incidents reported in East Hartford, CT
Something went wrong! Please refresh the page.
| Fire incidents reported | |
|---|---|
| Sreet name | Count |
| MAIN ST | 598 |
| BURNSIDE AVE | 308 |
| SILVER LN | 306 |
| TOLLAND ST | 158 |
| PARK AVE | 102 |
| FORBES ST | 90 |
| ROBERTS ST | 74 |
| SCHOOL ST | 74 |
| NUTMEG LN | 72 |
| GOODWIN ST | 70 |
| CONNECTICUT BLVD | 60 |
| ELLINGTON RD | 60 |
| HILLSIDE ST | 58 |
| EAST RIVER DR | 54 |
| WOODLAWN CIR | 54 |
| TURTLE CREEK LN | 48 |
| BREWER ST | 44 |
| CENTRAL AVE | 44 |
| COLUMBUS CIR | 42 |
| OAK ST | 42 |
| BELL CT | 40 |
| CANNON RD | 40 |
| BURNSIDE AV | 36 |
| ECOLOGY DR | 36 |
| FOREST ST | 36 |
| PROSPECT ST | 36 |
| PLAIN DR | 34 |
| GLENN RD | 32 |
| REMINGTON RD | 30 |
| CHURCH ST | 28 |
| Other | 100 |
2004 - 2018 National Fire Incident Reporting System (NFIRS) incidents
- Incident types reported to NFIRS in East Hartford, CT
- 27,62866.3%Rescue & EMS
- 4,51310.8%Hazardous Condition
- 2,8066.7%Fire
- 2,6456.3%False Alarm
- 2,6316.3%Service Call
- 1,4153.4%Good Intent Call
- Fire incident types reported to NFIRS in East Hartford, CT
- 1,20442.9%Structure Fires
- 1,01936.3%Outside Fires
- 49617.7%Mobile Property/Vehicle Fires
- 873.1%Other
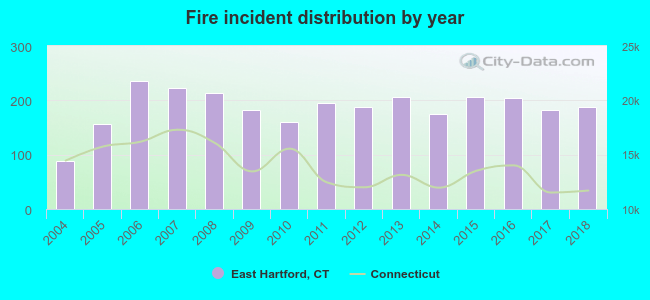 According to the data from the years 2004 - 2018 the average number of fires per year is 187. The highest number of fires - 235 took place in 2006, and the least - 89 in 2004. The data has an increasing trend.
The average number of yearly fire incidents per 10k residents in East Hartford, CT compared to nearest cities:
(Note: Based on data for the last 3 years, including only cities with population 5,000 and above)
| East Hartford: | 37.3 |
| Hartford: | 39.1 |
| Manchester: | 29.6 |
| Glastonbury: | 19.0 |
| Wethersfield: | 22.0 |
| South Windsor: | 16.3 |
| West Hartford: | 28.3 |
| Windsor: | 48.0 |
| Rocky Hill: | 51.8 |
 The median response time based on all reported fire incidents is 4 minutes. This is lower than the state median value.
The median response time in East Hartford, CT compared to nearest cities:
(Note: Based on data for all years, including only cities with at least 500 fire incidents)
| East Hartford: | 4 minutes |
| Hartford: | 4 minutes |
| Manchester: | 4 minutes |
| Glastonbury: | 6 minutes |
| Wethersfield: | 7 minutes |
| South Windsor: | 7 minutes |
| West Hartford: | 4 minutes |
| Windsor: | 6 minutes |
| Rocky Hill: | 7 minutes |
 According to the reports from the years 2004 - 2018 the average number of fire-related yearly deaths is 0. The highest number of deaths - 1 took place in 2004, and the lowest - 0 in 2005. The data has a declining trend.
The average number of fatalities per 1,000 fires is 2. This indicator was the highest - 11 in 2004, and the lowest 0 in 2005. The trend for deaths per 1,000 fire incidents is declining. Compared to the state value the number of deaths per 1,000 incidents is lower.
According to the reports from the years 2004 - 2018 the average number of fire-related yearly deaths is 0. The highest number of deaths - 1 took place in 2004, and the lowest - 0 in 2005. The data has a declining trend.
The average number of fatalities per 1,000 fires is 2. This indicator was the highest - 11 in 2004, and the lowest 0 in 2005. The trend for deaths per 1,000 fire incidents is declining. Compared to the state value the number of deaths per 1,000 incidents is lower.Deaths per 1,000 incidents in East Hartford, CT compared to nearest cities:
(Note: Based on data for all years, including only cities with at least 2,500 fire incidents)
| East Hartford: | 1.1 |
| Hartford: | 3.0 |
| Manchester: | 1.7 |
| West Hartford: | 1.6 |
| New Britain: | 1.2 |
| Middletown: | 0.9 |
| Enfield: | 2.5 |
| Bristol: | 1.5 |
| Meriden: | 1.6 |
 Based on the reports from the years 2004 - 2018 the average number of fire-related casualties per year is 6. The highest number of casualties - 15 took place in 2013, and the lowest - 1 in 2016. The data has a declining trend.
The average number of injuries per 1,000 fire incidents is 35. This indicator was the highest - 73 in 2013, and the lowest 5 in 2016. The trend for injuries per 1,000 incidents is dropping. Compared to the Connecticut value the number of casualties per 1,000 fires is much higher.
Based on the reports from the years 2004 - 2018 the average number of fire-related casualties per year is 6. The highest number of casualties - 15 took place in 2013, and the lowest - 1 in 2016. The data has a declining trend.
The average number of injuries per 1,000 fire incidents is 35. This indicator was the highest - 73 in 2013, and the lowest 5 in 2016. The trend for injuries per 1,000 incidents is dropping. Compared to the Connecticut value the number of casualties per 1,000 fires is much higher.Casualties per 1,000 incidents in East Hartford, CT compared to nearest cities:
(Note: Based on data for all years, including only cities with at least 500 fire incidents)
| East Hartford: | 34.6 |
| Hartford: | 10.9 |
| Manchester: | 28.9 |
| Glastonbury: | 16.7 |
| Wethersfield: | 21.5 |
| South Windsor: | 7.0 |
| West Hartford: | 18.4 |
| Windsor: | 1.1 |
| Rocky Hill: | 7.2 |
 29.7% incidents where reported in the morning and 70.3% in the evening. The most fires (15.1%) took place on Friday, and the least (13.2%) on Wednesday.
 According to the 2,806 incident reports from years 2004 - 2018 most fires (10.3%) took place during April, and the least (6.2%) in October.
 Out of all 41,684 cases reported during the years 2004 - 2018, the most belonged to the categories: Rescue & EMS (66.3%), Hazardous Condition (10.8%), and Fire (6.7%).
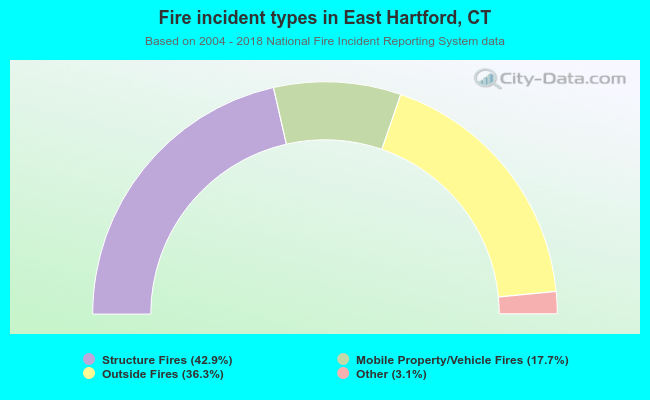 When looking into fire subcategories, the most incidents belonged to: Structure Fires (42.9%), and Outside Fires (36.3%).