East Lyme: Fire Incidents, Connecticut (CT)
Where are fire incidents reported in East Lyme, CT
Something went wrong! Please refresh the page.
|
| |||||||||||||||||||||||||||||||||||||||||||||||||||||||||||||||||||||||||||||||||||||||||||||||||||||||||||||
2002 - 2018 National Fire Incident Reporting System (NFIRS) incidents
- Incident types reported to NFIRS in East Lyme, CT
- 3,54358.8%Rescue & EMS
- 80113.3%Hazardous Condition
- 68611.4%Fire
- 3656.1%False Alarm
- 2844.7%Good Intent Call
- 2764.6%Service Call
- 570.9%Special Incident
- Fire incident types reported to NFIRS in East Lyme, CT
- 30444.3%Structure Fires
- 15021.9%Outside Fires
- 11717.1%Other
- 11516.8%Mobile Property/Vehicle Fires
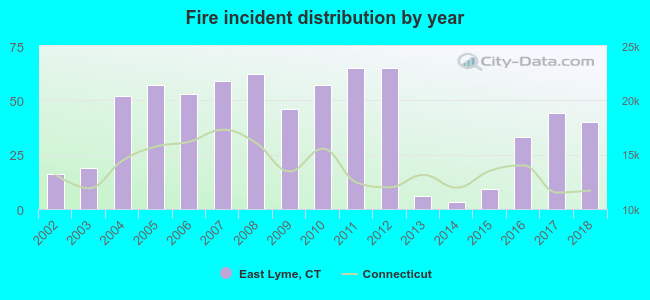 According to the data from the years 2002 - 2018 the average number of fire incidents per year is 40. The highest number of fires - 65 took place in 2011, and the least - 3 in 2014. The data has a growing trend.
The average number of yearly fire incidents per 10k residents in East Lyme, CT compared to nearest cities:
(Note: Based on data for the last 3 years, including only cities with population 5,000 and above)
| East Lyme: | 20.4 |
| Waterford: | 24.3 |
| Old Lyme: | 9.2 |
| New London: | 56.0 |
| Groton: | 75.6 |
| Montville: | 19.2 |
| Old Saybrook: | 66.7 |
| Essex: | 19.5 |
| Ledyard: | 22.6 |
 The median response time based on all reported fire incidents is 6 minutes. This is close to the state median value.
The median response time in East Lyme, CT compared to nearest cities:
(Note: Based on data for all years, including only cities with at least 500 fire incidents)
| East Lyme: | 6 minutes |
| Waterford: | 6 minutes |
| New London: | 4 minutes |
| Groton: | 4 minutes |
| Montville: | 7 minutes |
| Old Saybrook: | 4 minutes |
| Ledyard: | 9 minutes |
| Mystic: | 5 minutes |
| East Haddam: | 11 minutes |
 31.3% incidents where reported in the morning and 68.7% in the evening. The most fires (16.9%) took place on Saturday, and the least (11.8%) on Thursday.
 Based on the 686 fires from years 2002 - 2018 most fires (12.0%) took place during April, and the least (6.1%) in December.
 Out of all 6,022 cases reported during the years 2002 - 2018, the most belonged to the categories: Rescue & EMS (58.8%), Hazardous Condition (13.3%), and Fire (11.4%).
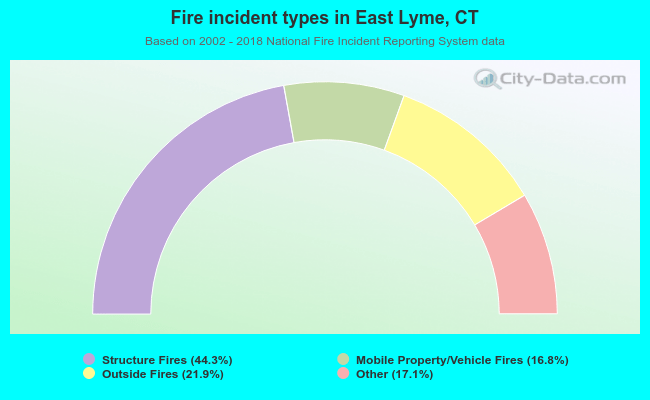 When looking into fire subcategories, the most incidents belonged to: Structure Fires (44.3%), and Outside Fires (21.9%).