East Quogue: Fire Incidents, New York (NY)
Where are fire incidents reported in East Quogue, NY
Something went wrong! Please refresh the page.
|
| |||||||||||||||||||||||||||||||||||||||||||||||||||||||||||||||||||||||||||||||||||||||||||||||||||||||||||||
2004 - 2018 National Fire Incident Reporting System (NFIRS) incidents
- Incident types reported to NFIRS in East Quogue, NY
- 1,00562.4%Rescue & EMS
- 20812.9%False Alarm
- 16410.2%Hazardous Condition
- 1408.7%Fire
- 744.6%Good Intent Call
- 171.1%Service Call
- Fire incident types reported to NFIRS in East Quogue, NY
- 8560.7%Structure Fires
- 3323.6%Outside Fires
- 2014.3%Mobile Property/Vehicle Fires
- 21.4%Other
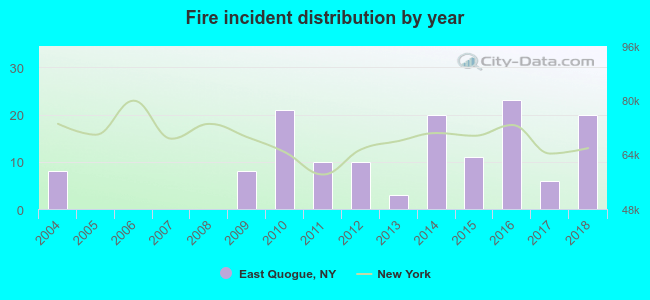 According to the data from the years 2004 - 2018 the average number of fire incidents per year is 9. The highest number of reported fires - 23 took place in 2016, and the least - 0 in 2005. The data has a growing trend.
 According to the reports from the years 2004 - 2018 the average number of fire-related casualties per year is 0. The highest number of injuries - 2 took place in 2014, and the lowest - 0 in 2004. The data has a growing trend.
 30.7% incidents where reported in the morning and 69.3% in the evening. The most fires (22.9%) took place on Sunday, and the least (11.4%) on Wednesday.
 According to the 140 reports from years 2004 - 2018 most fires (12.9%) took place during July, and the least (3.6%) in February.
 Out of all 1,610 cases reported during the years 2004 - 2018, the most belonged to the categories: Overpressure Rupture (62.4%), Good Intent Call (12.9%), and Rescue & EMS (10.2%).
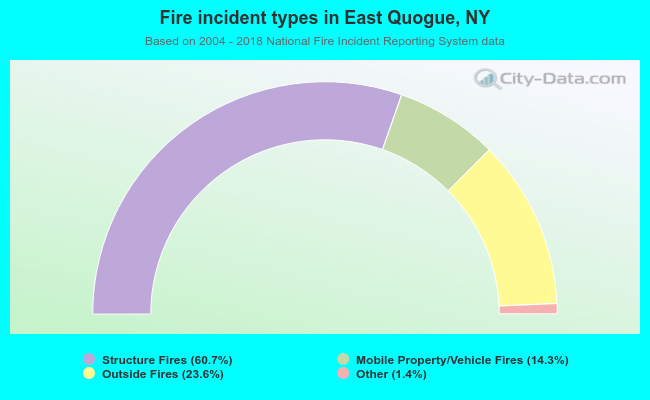 When looking into fire subcategories, the most incidents belonged to: Structure Fires (60.7%), and Outside Fires (23.6%).