Edinboro: Fire Incidents, Pennsylvania (PA)
Where are fire incidents reported in Edinboro, PA
Something went wrong! Please refresh the page.
|
| |||||||||||||||||||||||||||||||||||||||||||||||||||||||||||||||||||||||||||||||||||||||||||||||||||||||||||||
2004 - 2018 National Fire Incident Reporting System (NFIRS) incidents
- Incident types reported to NFIRS in Edinboro, PA
- 19543.6%Rescue & EMS
- 16136.0%Fire
- 357.8%Good Intent Call
- 296.5%Service Call
- 143.1%False Alarm
- 51.1%Special Incident
- 40.9%Hazardous Condition
- 40.9%Severe Weather
- Fire incident types reported to NFIRS in Edinboro, PA
- 12577.6%Structure Fires
- 2314.3%Other
- 116.8%Outside Fires
- 21.2%Mobile Property/Vehicle Fires
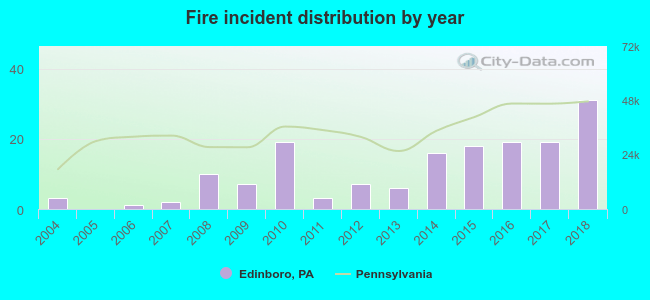 According to the data from the years 2004 - 2018 the average number of fire incidents per year is 11. The highest number of reported fires - 31 took place in 2018, and the least - 0 in 2005. The data has an increasing trend.
The average number of yearly fire incidents per 10k residents in Edinboro, PA compared to nearest cities:
(Note: Based on data for the last 3 years, including only cities with population 5,000 and above)
| Edinboro: | 35.7 |
| Meadville: | 117.1 |
| Erie: | 71.6 |
| Corry: | 38.7 |
| Titusville: | 66.4 |
| Greenville: | 134.0 |
| Sugarcreek: | 7.1 |
| Franklin: | 36.2 |

 39.8% incidents where reported in the morning and 60.2% in the evening. The most fires (19.3%) took place on Wednesday, and the least (8.7%) on Friday.
 Based on the 161 incident reports from years 2004 - 2018 most fires (17.4%) took place during March, and the least (2.5%) in July.
 Out of all 447 cases reported during the years 2004 - 2018, the most belonged to the categories: Overpressure Rupture (43.6%), Fire (36.0%), and Service Call (7.8%).
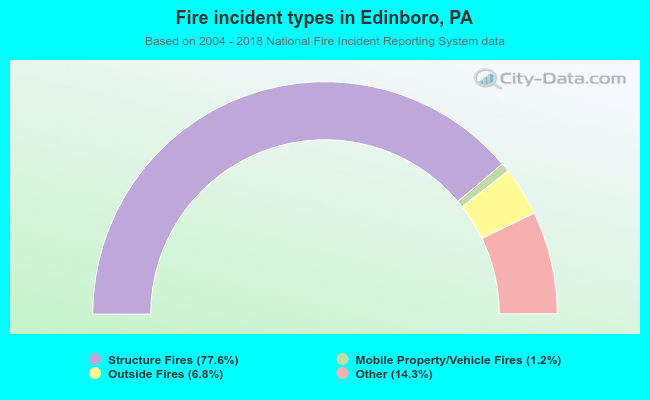 When looking into fire subcategories, the most reports belonged to: Structure Fires (77.6%), and Other (14.3%).