Edinburg: Fire Incidents, Illinois (IL)
Where are fire incidents reported in Edinburg, IL
Something went wrong! Please refresh the page.
|
| |||||||||||||||||||||||||||||||||||||||||||||||||||||||||||||||||||||||||||||||||||||||||||||||||||||||||||||
| Other | 16 | |||||||||||||||||||||||||||||||||||||||||||||||||||||||||||||||||||||||||||||||||||||||||||||||||||||||||||||
2002 - 2018 National Fire Incident Reporting System (NFIRS) incidents
- Incident types reported to NFIRS in Edinburg, IL
- 37951.6%Rescue & EMS
- 21028.6%Fire
- 689.3%Hazardous Condition
- 456.1%Good Intent Call
- 172.3%Service Call
- 101.4%False Alarm
- 50.7%Severe Weather
- Fire incident types reported to NFIRS in Edinburg, IL
- 9143.3%Outside Fires
- 7837.1%Structure Fires
- 2913.8%Mobile Property/Vehicle Fires
- 125.7%Other
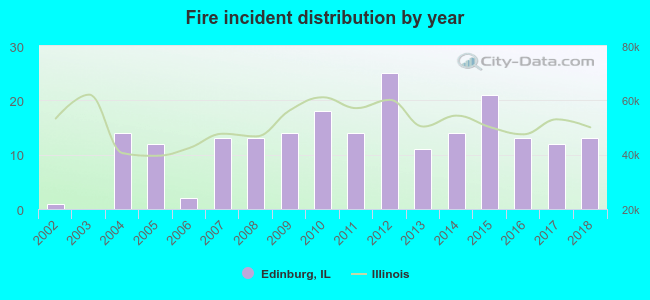 According to the data from the years 2002 - 2018 the average number of fire incidents per year is 12. The highest number of reported fire incidents - 25 took place in 2012, and the least - 0 in 2003. The data has a rising trend.
 27.1% incidents where reported in the morning and 72.9% in the evening. The most fires (25.2%) took place on Saturday, and the least (8.1%) on Thursday.
 Based on the 210 fire incident reports from years 2002 - 2018 most fires (18.6%) took place during March, and the least (4.8%) in July.
 Out of all 734 cases reported during the years 2002 - 2018, the most belonged to the categories: Overpressure Rupture (51.6%), Fire (28.6%), and Rescue & EMS (9.3%).
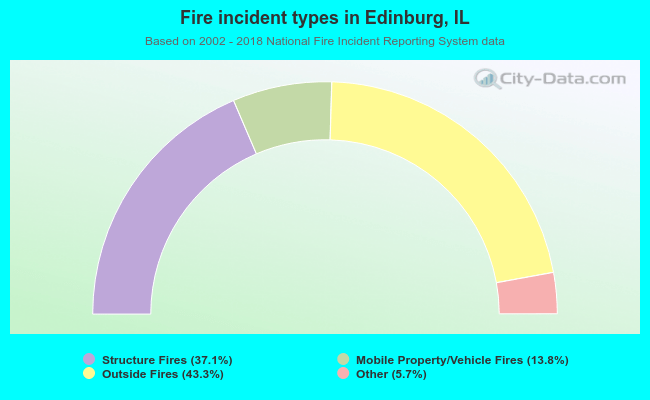 When looking into fire subcategories, the most reports belonged to: Outside Fires (43.3%), and Structure Fires (37.1%).