| Fire incidents reported |
|---|
| Sreet name | Count |
|---|
| 3787 CHEYENNE ROAD | 6 | | JOHN | 6 | | WILLIAM | 6 | | 238TH & BOURBON ROAD | 4 | | 238TH CLAY ROAD | 4 | | 254TH & GRAMHAM ROAD | 4 | | 262ND & JEWELL ROAD | 4 | | 266TH TIGER ROAD | 4 | | 278 TH & GRAHMAN ROAD | 4 | | 286 RD | 4 | | 3RD | 4 | | 4230 CHEYENNE ROAD | 4 | | 4301 HAMILTON ROAD | 4 | | 4785 - 286TH ROAD | 4 | | 4850 286TH ROAD RDS | 4 | | 5200 US HWY 159 | 4 | | 5281 US 159 HWY | 4 | | 6089 BOURBON ROAD | 4 | | 6587 & US 159 HWY. | 4 | | 6606 HASKELL ROAD | 4 | | 7136 HAMILTON ROAD | 4 | | 7530 US HWY 159 | 4 | | 8545 274TH ROAD | 4 | | 9668 K9 HWY | 4 | | ELIZABETH | 4 |
| | | Fire incidents reported |
|---|
| Sreet name | Count |
|---|
| ELLSWORTH RD | 4 | | K-116 & BOURBON ROAD | 4 | | SOUTH OF 254TH ON HASKELL | 4 | | 1/2 MILE S. 246 & EDWARDS | 2 | | 10288 HAMILTON ROAD | 2 | | 10442 266TH RD | 2 | | 10774 258TH ROAD | 2 | | 10774 258TH RD | 2 | | 108 -3RD STREET | 2 | | 10859 K9 HIGHWAY | 2 | | 1101 SEABURY STREET | 2 | | 11201 262ND ROAD | 2 | | 11365 US HWY 159 | 2 | | 117 WILLIAMS STREET | 2 | | 13669-US159 HIGHWAY | 2 | | 1605 EDWARDS ROAD | 2 | | 214TH ST | 2 | | 222ND CLAY | 2 | | 230 RD | 2 | | 238TH & DICKINSON ROAD | 2 | | 238TH & EDWARDS ROAD | 2 | | 246 TH & DECATUR | 2 | | 246TH & GRAMHAM ROAD | 2 | | 246TH GRAHAM ROAD | 2 | | |
|
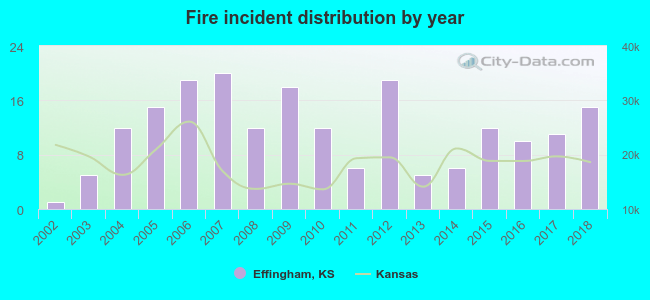 Based on the data from the years 2002 - 2018 the average number of fires per year is 12. The highest number of fires - 20 took place in 2007, and the least - 1 in 2002. The data has a rising trend.
 29.8% incidents where reported in the morning and 70.2% in the evening. The most fires (17.2%) took place on Wednesday, and the least (12.1%) on Tuesday.
 According to the 198 fire incidents from years 2002 - 2018 most fires (19.2%) took place during March, and the least (2.0%) in November.
 Out of all 374 cases reported during the years 2002 - 2018, the most belonged to the categories: Fire (52.9%), Rescue & EMS (35.6%), and Good Intent Call (3.7%).
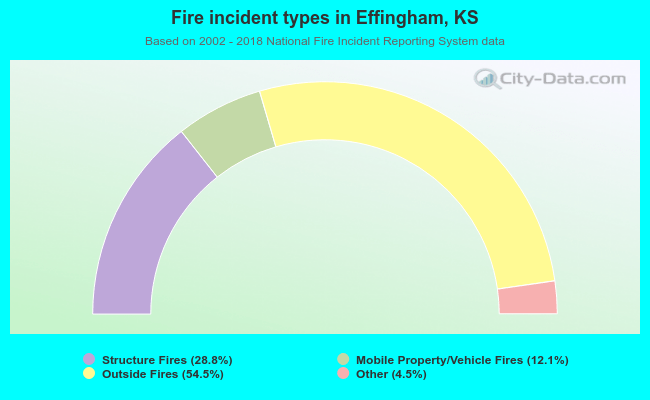 When looking into fire subcategories, the most reports belonged to: Outside Fires (54.5%), and Structure Fires (28.8%).