Elk City: Fire Incidents, Kansas (KS)
Where are fire incidents reported in Elk City, KS
Something went wrong! Please refresh the page.
|
| |||||||||||||||||||||||||||||||||||||||||||||||||||||||||||||||||||||||||||||||||||||||||||||||||||||||||||||
| Other | 70 | |||||||||||||||||||||||||||||||||||||||||||||||||||||||||||||||||||||||||||||||||||||||||||||||||||||||||||||
2005 - 2018 National Fire Incident Reporting System (NFIRS) incidents
- Incident types reported to NFIRS in Elk City, KS
- 36456.3%Fire
- 20531.7%Rescue & EMS
- 304.6%Good Intent Call
- 213.2%Hazardous Condition
- 142.2%Severe Weather
- 111.7%Service Call
- 20.3%False Alarm
- Fire incident types reported to NFIRS in Elk City, KS
- 28678.6%Outside Fires
- 5715.7%Structure Fires
- 164.4%Mobile Property/Vehicle Fires
- 51.4%Other
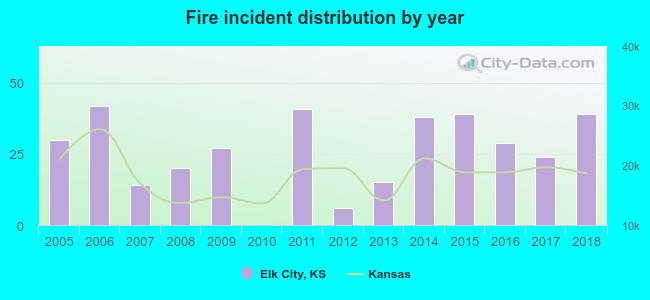 Based on the data from the years 2005 - 2018 the average number of fire incidents per year is 26. The highest number of fires - 42 took place in 2006, and the least - 0 in 2010. The data has a growing trend.
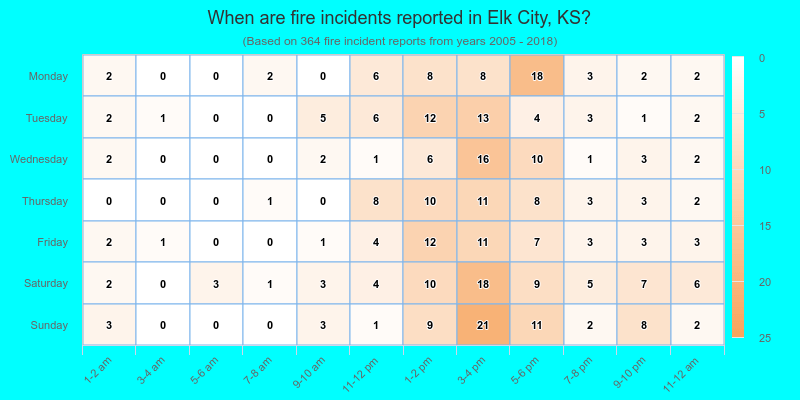
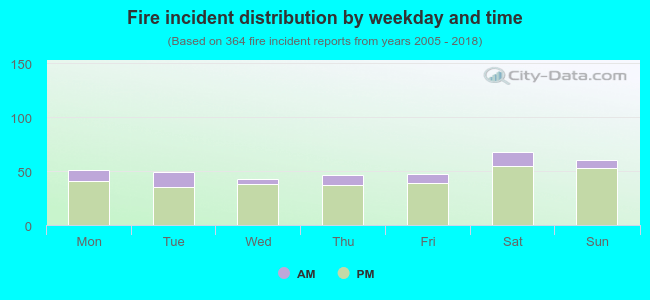 18.1% incidents where reported in the morning and 81.9% in the evening. The most fires (18.7%) took place on Saturday, and the least (11.8%) on Wednesday.
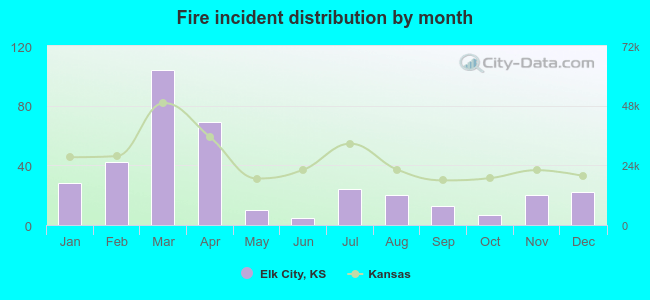 According to the 364 fire incidents from years 2005 - 2018 most fires (28.6%) took place during March, and the least (1.4%) in June.
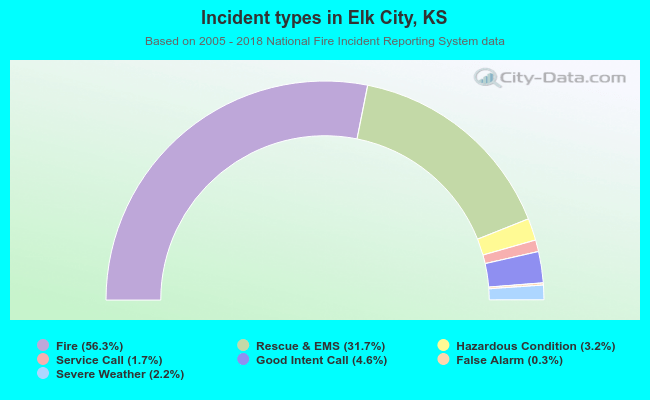 Out of all 647 cases reported during the years 2005 - 2018, the most belonged to the categories: Fire (56.3%), Overpressure Rupture (31.7%), and Service Call (4.6%).
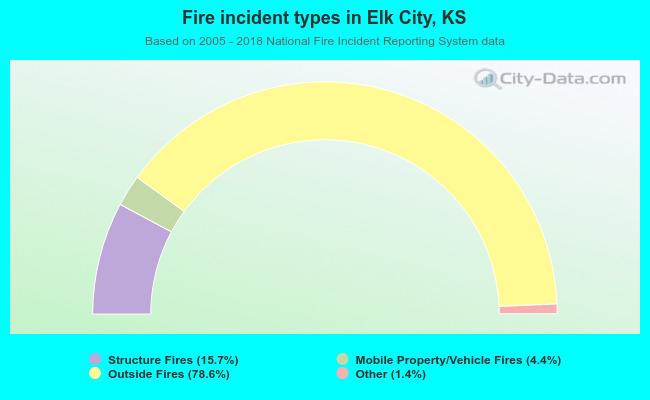 When looking into fire subcategories, the most incidents belonged to: Outside Fires (78.6%), and Structure Fires (15.7%).