Elmwood: Fire Incidents, Wisconsin (WI)
Where are fire incidents reported in Elmwood, WI
Something went wrong! Please refresh the page.
|
| |||||||||||||||||||||||||||||||||||||||||||||||||||||||||||||||||||||||||||||||||||||||||||||||||||||||||||||
2004 - 2018 National Fire Incident Reporting System (NFIRS) incidents
- Incident types reported to NFIRS in Elmwood, WI
- 10571.9%Fire
- 2013.7%Hazardous Condition
- 106.8%Good Intent Call
- 74.8%Rescue & EMS
- 32.1%Service Call
- 10.7%False Alarm
- Fire incident types reported to NFIRS in Elmwood, WI
- 4441.9%Structure Fires
- 3230.5%Outside Fires
- 2523.8%Mobile Property/Vehicle Fires
- 43.8%Other
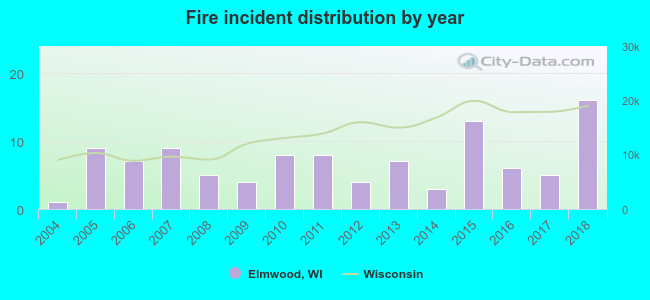 Based on the data from the years 2004 - 2018 the average number of fires per year is 7. The highest number of fires - 16 took place in 2018, and the least - 1 in 2004. The data has a growing trend.
 27.6% incidents where reported in the morning and 72.4% in the evening. The most fires (20.0%) took place on Saturday, and the least (10.5%) on Friday.
 Based on the 105 fire incident reports from years 2004 - 2018 most fires (21.0%) took place during April, and the least (2.9%) in June.
 Out of all 146 cases reported during the years 2004 - 2018, the most belonged to the categories: Fire (71.9%), Rescue & EMS (13.7%), and Service Call (6.8%).
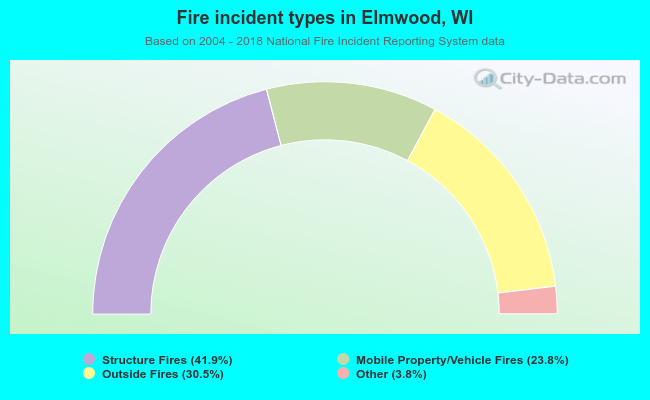 When looking into fire subcategories, the most reports belonged to: Structure Fires (41.9%), and Outside Fires (30.5%).