| Fire incidents reported |
|---|
| Sreet name | Count |
|---|
| ELWOOD RD | 44 | | WHITE HORSE PIKE PIKE | 34 | | MOSS MILL RD | 28 | | DARMSTADT AVE | 26 | | READING AVE | 26 | | WHITE HORSE PIKE | 26 | | ANNA DR | 20 | | WEYMOUTH RD | 16 | | COLUMBIA RD | 14 | | DUERER ST | 12 | | WHITE HORSE PIKE | 12 | | 30 RT | 10 | | 7TH AVE | 10 | | ADAMS CIR | 10 | | WHARTON PARK BLVD | 10 | | 5TH AVE | 6 | | BURDICK AVE | 6 | | HAMBURG AVE | 6 | | NESCO RD | 6 | | PITTSBURG AVE | 6 | | WEEKSTOWN RD | 6 | | 1630 7TH AVE | 4 | | 23RD AVE | 4 | | 435 BURDICK AVE | 4 | | ANDERSON AVE | 4 |
| | | Fire incidents reported |
|---|
| Sreet name | Count |
|---|
| BLACK OAK DR | 4 | | CHEW RD | 4 | | FIRST AVE | 4 | | HEIDELBERG AVE | 4 | | LOCUST ST | 4 | | OLD EGG HARBOR RD | 4 | | READING AVENUE | 4 | | RT. 30 | 4 | | TOMACOMA DR | 4 | | WHITEHORSE PIKE | 4 | | 11 ST | 2 | | 1ST RD | 2 | | 1ST ST | 2 | | 35 HANGER RD | 2 | | 4130 ANNA DR | 2 | | 5057 PLEASANT MILLS RD | 2 | | 5TH AVENUE | 2 | | 7TH | 2 | | 7TH ST | 2 | | ABSECON AVE | 2 | | ADAMS CIRCLE RD | 2 | | ADAMS CIRCLE ST | 2 | | ANNA DRIV | 2 | | ANNA DRIVE | 2 | | |
|
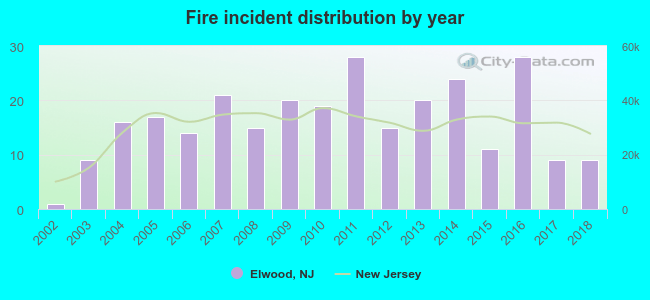 According to the data from the years 2002 - 2018 the average number of fires per year is 16. The highest number of reported fire incidents - 28 took place in 2011, and the least - 1 in 2002. The data has a growing trend.
 27.9% incidents where reported in the morning and 72.1% in the evening. The most fires (18.8%) took place on Friday, and the least (6.9%) on Wednesday.
 Based on the 276 fires from years 2002 - 2018 most fires (12.0%) took place during April, and the least (3.6%) in May.
 Out of all 1,058 cases reported during the years 2002 - 2018, the most belonged to the categories: Rescue & EMS (36.0%), Fire (26.1%), and Service Call (17.8%).
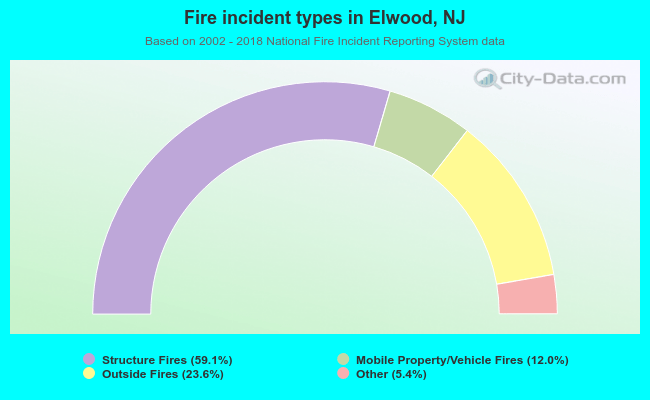 When looking into fire subcategories, the most reports belonged to: Structure Fires (59.1%), and Outside Fires (23.6%).