Enoch: Fire Incidents, Utah (UT)
Where are fire incidents reported in Enoch, UT
Something went wrong! Please refresh the page.
|
| |||||||||||||||||||||||||||||||||||||||||||||||||||||||||||||||||||||||||||||||||||||||||||||||||||||||||||||
2002 - 2018 National Fire Incident Reporting System (NFIRS) incidents
- Incident types reported to NFIRS in Enoch, UT
- 15136.9%Fire
- 10425.4%Hazardous Condition
- 6215.2%Service Call
- 409.8%False Alarm
- 389.3%Good Intent Call
- 122.9%Rescue & EMS
- 10.2%Overpressure Rupture
- 10.2%Special Incident
- Fire incident types reported to NFIRS in Enoch, UT
- 8958.9%Outside Fires
- 5033.1%Structure Fires
- 106.6%Mobile Property/Vehicle Fires
- 21.3%Other
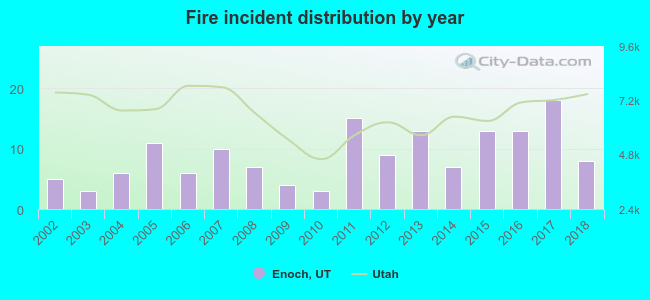 Based on the data from the years 2002 - 2018 the average number of fire incidents per year is 9. The highest number of fires - 18 took place in 2017, and the least - 3 in 2003. The data has a growing trend.
The average number of yearly fire incidents per 10k residents in Enoch, UT compared to nearest cities:
(Note: Based on data for the last 3 years, including only cities with population 5,000 and above)
| Enoch: | 21.3 |
| Cedar City: | 27.7 |
| Hurricane: | 43.5 |
| Washington: | 11.1 |
| Ivins: | 24.8 |
| Santa Clara: | 23.0 |
| Richfield: | 31.5 |
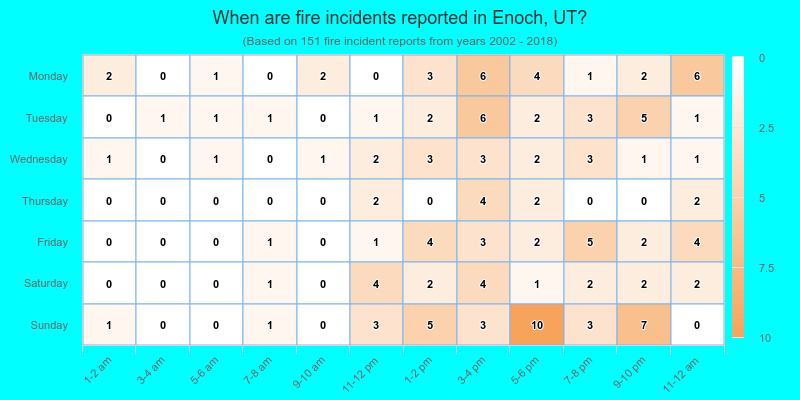
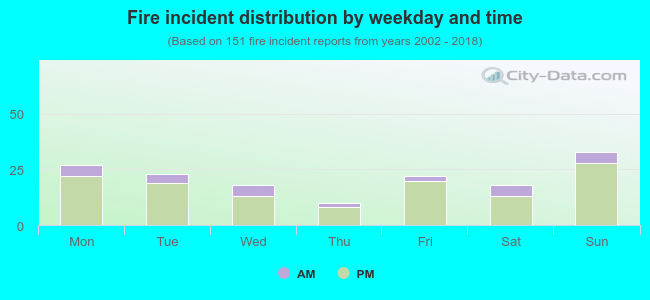 18.5% incidents where reported in the morning and 81.5% in the evening. The most fires (21.9%) took place on Sunday, and the least (6.6%) on Thursday.
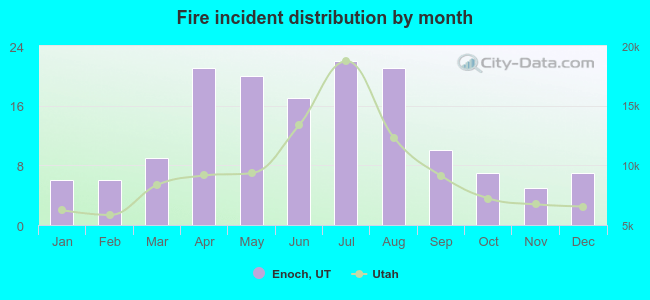 According to the 151 fires from years 2002 - 2018 most fires (14.6%) took place during July, and the least (3.3%) in November.
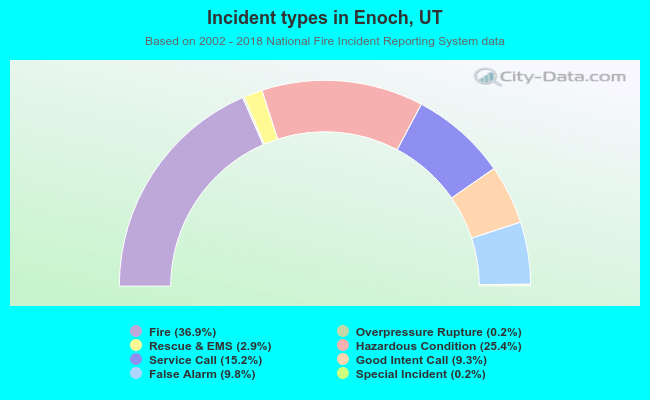 Out of all 409 cases reported during the years 2002 - 2018, the most belonged to the categories: Fire (36.9%), Hazardous Condition (25.4%), and Service Call (15.2%).
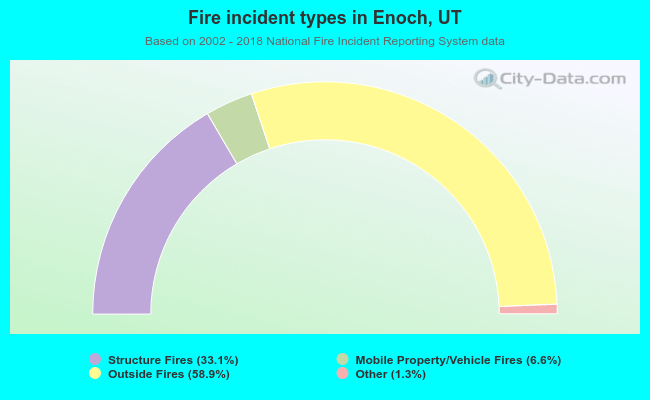 When looking into fire subcategories, the most reports belonged to: Outside Fires (58.9%), and Structure Fires (33.1%).