Erving: Fire Incidents, Massachusetts (MA)
Where are fire incidents reported in Erving, MA
Something went wrong! Please refresh the page.
|
| |||||||||||||||||||||||||||||||||||||||||||||||||||||||||||||||||||||||||||||||||||||||||||||||||||||||||||||
2002 - 2018 National Fire Incident Reporting System (NFIRS) incidents
- Incident types reported to NFIRS in Erving, MA
- 65558.8%Rescue & EMS
- 23821.4%Fire
- 726.5%Service Call
- 625.6%False Alarm
- 524.7%Hazardous Condition
- 242.2%Good Intent Call
- 80.7%Special Incident
- 20.2%Overpressure Rupture
- Fire incident types reported to NFIRS in Erving, MA
- 11447.9%Structure Fires
- 8837.0%Outside Fires
- 2811.8%Other
- 83.4%Mobile Property/Vehicle Fires
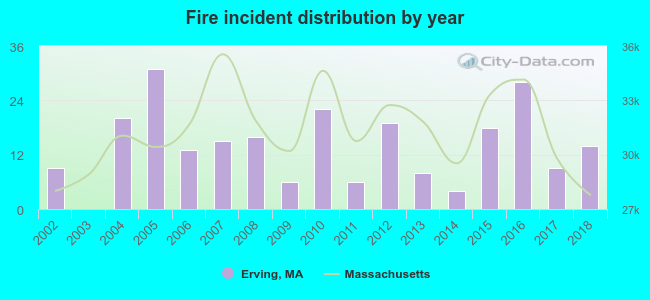 Based on the data from the years 2002 - 2018 the average number of fires per year is 14. The highest number of fires - 31 took place in 2005, and the least - 0 in 2003. The data has a growing trend.
 32.8% incidents where reported in the morning and 67.2% in the evening. The most fires (17.2%) took place on Monday, and the least (8.4%) on Saturday.
 Based on the 238 fires from years 2002 - 2018 most fires (18.9%) took place during April, and the least (1.7%) in January.
 Out of all 1,113 cases reported during the years 2002 - 2018, the most belonged to the categories: Rescue & EMS (58.8%), Fire (21.4%), and Service Call (6.5%).
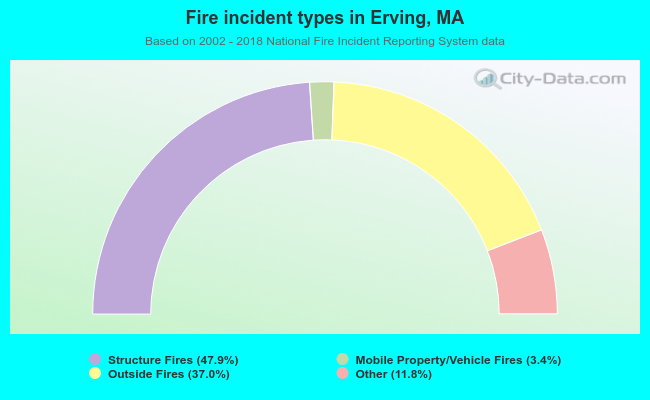 When looking into fire subcategories, the most incidents belonged to: Structure Fires (47.9%), and Outside Fires (37.0%).