Estero: Fire Incidents, Florida (FL)
Where are fire incidents reported in Estero, FL
Something went wrong! Please refresh the page.
| Fire incidents reported | |
|---|---|
| Sreet name | Count |
| CORKSCREW RD | 284 |
| INTERSTATE 75 | 148 |
| TAMIAMI TRL | 122 |
| BROADWAY AVE | 82 |
| OUT OF DISTRICT | 52 |
| THREE OAKS PKY | 34 |
| CARTER RD | 26 |
| MEDITERRANEAN DR | 26 |
| CHARRING CROSS CIR | 24 |
| SIX L'S FARM RD | 22 |
| SKIDMORE WAY | 22 |
| BELLA TERRA BLVD | 20 |
| SHERRILL LANE | 20 |
| PARK AVE | 18 |
| LEUTTICH LANE | 16 |
| WILDCAT RUN DR | 16 |
| ALICO RD | 14 |
| BRIXHAM RUN LOOP | 14 |
| BURGUNDY FARMS RD | 14 |
| COCONUT RD | 14 |
| LAZY D FARM RD | 14 |
| WILLIAMS RD | 14 |
| BEN HILL GRIFFIN RD | 12 |
| FASHION DR | 12 |
| FOUNTAIN LAKES BLVD | 12 |
| GRANDE OAK SHOPPES BLVD | 12 |
| ROOKERY DR | 12 |
| CORKSCREW COMMONS DR | 10 |
| DUSTY LA | 10 |
| ESTERO GARDENS CIR | 10 |
| Other | 215 |
2002 - 2018 National Fire Incident Reporting System (NFIRS) incidents
- Incident types reported to NFIRS in Estero, FL
- 9,83161.1%Rescue & EMS
- 1,98312.3%Good Intent Call
- 1,3218.2%Fire
- 1,2417.7%Service Call
- 1,0976.8%False Alarm
- 5883.7%Hazardous Condition
- Fire incident types reported to NFIRS in Estero, FL
- 76357.8%Outside Fires
- 31123.5%Structure Fires
- 23317.6%Mobile Property/Vehicle Fires
- 141.1%Other
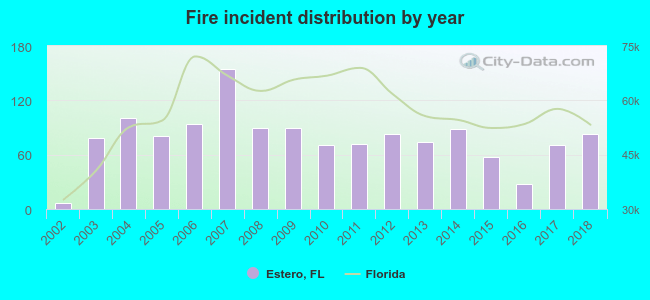 According to the data from the years 2002 - 2018 the average number of fire incidents per year is 78. The highest number of reported fires - 155 took place in 2007, and the least - 7 in 2002. The data has a growing trend.
The average number of yearly fire incidents per 10k residents in Estero, FL compared to nearest cities:
(Note: Based on data for the last 3 years, including only cities with population 5,000 and above)
| Estero: | 26.8 |
| San Carlos Park: | 0.6 |
| Bonita Springs: | 27.4 |
| Fort Myers Beach: | 6.9 |
| Gateway: | 1.2 |
| Fort Myers: | 97.1 |
| Lehigh Acres: | 39.2 |
| Sanibel: | 40.4 |
| Cape Coral: | 14.4 |
 The median response time based on all reported fire incidents is 6 minutes. This is similar to the state median value.
The median response time in Estero, FL compared to nearest cities:
(Note: Based on data for all years, including only cities with at least 500 fire incidents)
| Estero: | 6 minutes |
| Bonita Springs: | 6 minutes |
| Fort Myers: | 5 minutes |
| Lehigh Acres: | 7 minutes |
| Cape Coral: | 6 minutes |
| North Fort Myers: | 6 minutes |
| Naples: | 6 minutes |
| Alva: | 7 minutes |
| Immokalee: | 6 minutes |
 According to the reports from the years 2002 - 2018 the average number of fire-related casualties per year is 0. The highest number of reported casualties - 1 took place in 2005, and the lowest - 0 in 2002. The data has a rising trend.
The average number of casualties per 1,000 fires is 3. This indicator was the highest - 14 in 2011, and the lowest 0 in 2002. The trend for casualties per 1,000 fires is increasing. Compared to the Florida value the number of casualties per 1,000 fires is much lower.
According to the reports from the years 2002 - 2018 the average number of fire-related casualties per year is 0. The highest number of reported casualties - 1 took place in 2005, and the lowest - 0 in 2002. The data has a rising trend.
The average number of casualties per 1,000 fires is 3. This indicator was the highest - 14 in 2011, and the lowest 0 in 2002. The trend for casualties per 1,000 fires is increasing. Compared to the Florida value the number of casualties per 1,000 fires is much lower.Casualties per 1,000 incidents in Estero, FL compared to nearest cities:
(Note: Based on data for all years, including only cities with at least 500 fire incidents)
| Estero: | 3.8 |
| Bonita Springs: | 5.2 |
| Fort Myers: | 15.4 |
| Lehigh Acres: | 10.9 |
| Cape Coral: | 13.1 |
| North Fort Myers: | 7.1 |
| Naples: | 8.3 |
| Alva: | 7.9 |
| Immokalee: | 24.3 |
 26.3% incidents where reported in the morning and 73.7% in the evening. The most fires (16.3%) took place on Saturday, and the least (12.3%) on Thursday.
 According to the 1,321 fire incident reports from years 2002 - 2018 most fires (15.7%) took place during May, and the least (5.5%) in December.
 Out of all 16,087 cases reported during the years 2002 - 2018, the most belonged to the categories: Rescue & EMS (61.1%), Good Intent Call (12.3%), and Fire (8.2%).
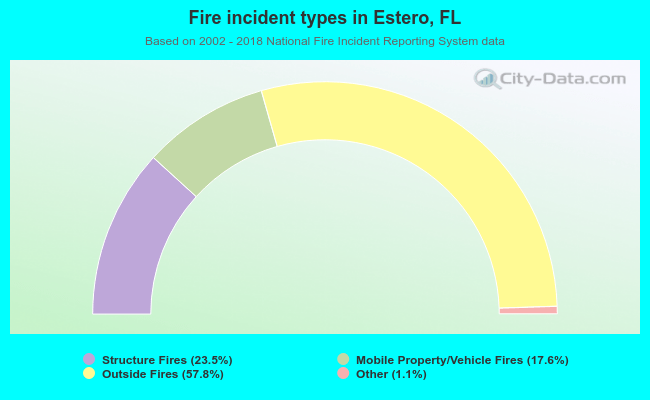 When looking into fire subcategories, the most incidents belonged to: Outside Fires (57.8%), and Structure Fires (23.5%).