| Fire incidents reported |
|---|
| Sreet name | Count |
|---|
| 15 MILES NE | 6 | | 15 MILES SW | 6 | | 10 MILES SE OF EUREKA | 4 | | 11 MILES SE | 4 | | 11 MILES SW | 4 | | 11115 327TH AVE | 4 | | 15 MILES NW | 4 | | 16 MILES NE | 4 | | 16 MILES NW | 4 | | 16 MILES SW | 4 | | 20 MILES NE | 4 | | 4 MI SW | 4 | | 8 MILES NE | 4 | | EUREKA | 4 | | 10 MILES NORTHWEST OF EUREKA | 2 | | 10 MILES NW OF EUREKA | 2 | | 10 MILES SOUTHEAST OF EUREKA | 2 | | 10 MILES SW | 2 | | 10 MILES WEST | 2 | | 10 MILS SE | 2 | | 1002 K AVE | 2 | | 10857 343RD AVE | 2 | | 11 MI SE | 2 | | 11029 319TH AVE. | 2 | | 11410 341ST ST | 2 |
| | | Fire incidents reported |
|---|
| Sreet name | Count |
|---|
| 117TH ST | 2 | | 12 MI SOUTH | 2 | | 12 MI SW | 2 | | 12 MILE NE | 2 | | 12 MILES EAST | 2 | | 12 MILES SE | 2 | | 12 TH ST | 2 | | 13 MILES E OF EUREKA ON HWY 10 | 2 | | 13 MILES NORTH OF EUREKA | 2 | | 13 MILES NW | 2 | | 13 MILES SE | 2 | | 14 MILES NE | 2 | | 14 MILES SE OF EUREKA | 2 | | 15 MI NE | 2 | | 16 MI SW | 2 | | 17 MILES EAST | 2 | | 17 MILES SW | 2 | | 18 MILES SW | 2 | | 19 MILES SW | 2 | | 2 12 MILES SOUTH | 2 | | 2 MI EAST | 2 | | 2 MILES EAST | 2 | | 25 MI NE | 2 | | 30 MILES SE | 2 | | |
|
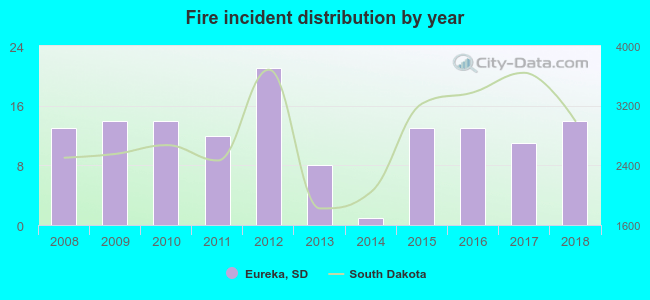 According to the data from the years 2008 - 2018 the average number of fire incidents per year is 12. The highest number of fire incidents - 21 took place in 2012, and the least - 1 in 2014. The data has a rising trend.
 18.7% incidents where reported in the morning and 81.3% in the evening. The most fires (19.4%) took place on Friday, and the least (10.4%) on Monday.
 Based on the 134 incident reports from years 2008 - 2018 most fires (15.7%) took place during July, and the least (1.5%) in February.
 Out of all 159 cases reported during the years 2008 - 2018, the most belonged to the categories: Fire (84.3%), Good Intent Call (8.2%), and Overpressure Rupture (2.5%).
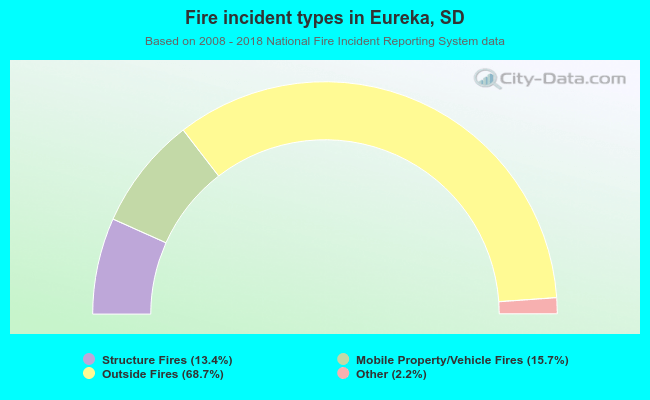 When looking into fire subcategories, the most reports belonged to: Outside Fires (68.7%), and Mobile Property/Vehicle Fires (15.7%).