| Fire incidents reported |
|---|
| Sreet name | Count |
|---|
| ELIZAVILLE RD | 16 | | ELIZAVILLE RD | 14 | | US 68 | 12 | | EWING RD | 8 | | EWING RD | 8 | | TEA RUN RD | 8 | | BUCHANAN RD | 6 | | EWING ROAD | 6 | | MT TABOR RD | 6 | | CONNECTOR RD | 4 | | ELIZAVILLE ROAD | 4 | | ENERGY RD | 4 | | HILLTOP RD | 4 | | HILLTOP RD | 4 | | JOHNSON CREEK RD | 4 | | MT. TABOR RD | 4 | | NEPTON RD | 4 | | 1160 DEER LICK RD | 2 | | 1451 DEERLICK ROAD | 2 | | 149 MT TABOR RD | 2 | | 1506 CONNECTOR RD | 2 | | 1813 CONNECTOR ROAD | 2 | | 242 REGAL LN | 2 | | 2685 BUCHANNAN RD | 2 | | 304 CONNECTOR RD | 2 |
| | | Fire incidents reported |
|---|
| Sreet name | Count |
|---|
| 36 MORFORD ST | 2 | | 37 JOHNSON CREEK ROAD | 2 | | 3793 EWING ROAD | 2 | | 4936 ELIZAVILLE RD | 2 | | 4985 ELIZAVILLE ROAD | 2 | | 8091 ELIZAVILLE RD | 2 | | 9465 ELIZAVILLE RD | 2 | | ABNER MILL RD | 2 | | BUCHANAN RD | 2 | | BUCHANNAN RD | 2 | | BUCHANNON RD | 2 | | BUCHANON ROAD | 2 | | CLOVER HILL RD | 2 | | CLOVERHILL RD | 2 | | COLMIRE RD | 2 | | CONNECTOR RD | 2 | | CONNECTOR RD | 2 | | CONNECTOR ROAD FLEMING CO | 2 | | CONNECTOR ROADFLEMING | 2 | | CONNIE LN | 2 | | COWAN LOOP | 2 | | CRAINTOWN RD | 2 | | DEER LICK ROAD | 2 | | DELANY RD | 2 | | ELIZAVILLE RD CRAINTOWN RD | 2 |
|
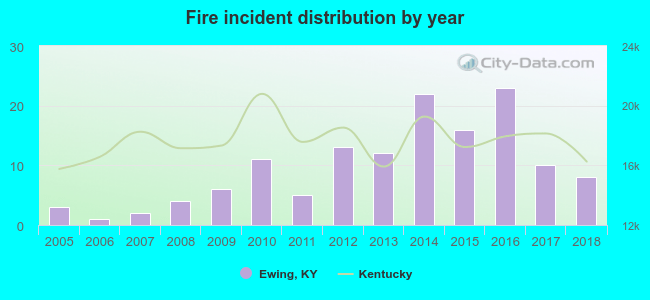 According to the data from the years 2005 - 2018 the average number of fire incidents per year is 10. The highest number of reported fires - 23 took place in 2016, and the least - 1 in 2006. The data has a growing trend.
 30.9% incidents where reported in the morning and 69.1% in the evening. The most fires (21.3%) took place on Saturday, and the least (11.8%) on Monday.
 Based on the 136 fires from years 2005 - 2018 most fires (15.4%) took place during April, and the least (2.9%) in September.
 Out of all 506 cases reported during the years 2005 - 2018, the most belonged to the categories: Overpressure Rupture (63.8%), Fire (26.9%), and Service Call (4.2%).
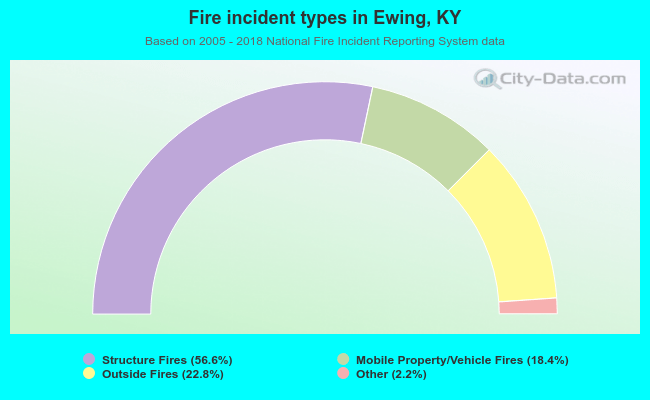 When looking into fire subcategories, the most reports belonged to: Structure Fires (56.6%), and Outside Fires (22.8%).