Fairless Hills: Fire Incidents, Pennsylvania (PA)
Where are fire incidents reported in Fairless Hills, PA
Something went wrong! Please refresh the page.
|
| |||||||||||||||||||||||||||||||||||||||||||||||||||||||||||||||||||||||||||||||||||||||||||||||||||||||||||||
2003 - 2018 National Fire Incident Reporting System (NFIRS) incidents
- Incident types reported to NFIRS in Fairless Hills, PA
- 41033.6%Fire
- 29324.0%False Alarm
- 23719.4%Hazardous Condition
- 13110.7%Rescue & EMS
- 13010.6%Good Intent Call
- 161.3%Service Call
- 20.2%Overpressure Rupture
- 20.2%Special Incident
- Fire incident types reported to NFIRS in Fairless Hills, PA
- 28870.2%Structure Fires
- 5112.4%Outside Fires
- 4210.2%Mobile Property/Vehicle Fires
- 297.1%Other
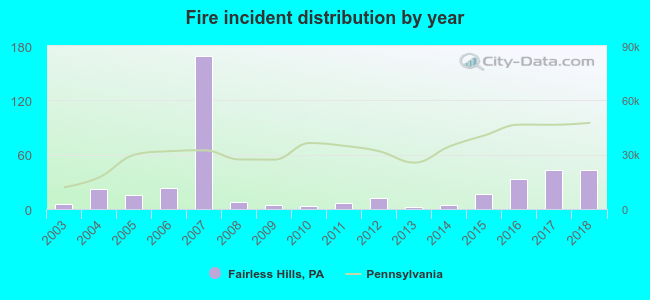 Based on the data from the years 2003 - 2018 the average number of fire incidents per year is 26. The highest number of fire incidents - 169 took place in 2007, and the least - 2 in 2013. The data has a growing trend.
The average number of yearly fire incidents per 10k residents in Fairless Hills, PA compared to nearest cities:
(Note: Based on data for the last 3 years, including only cities with population 5,000 and above)
| Fairless Hills: | 46.9 |
| Levittown: | 47.2 |
| Morrisville: | 86.5 |
| Bristol: | 101.1 |
| Croydon: | 30.2 |
| Richboro: | 9.1 |
| Hatboro: | 25.1 |
| Willow Grove: | 12.9 |
| Horsham: | 23.8 |
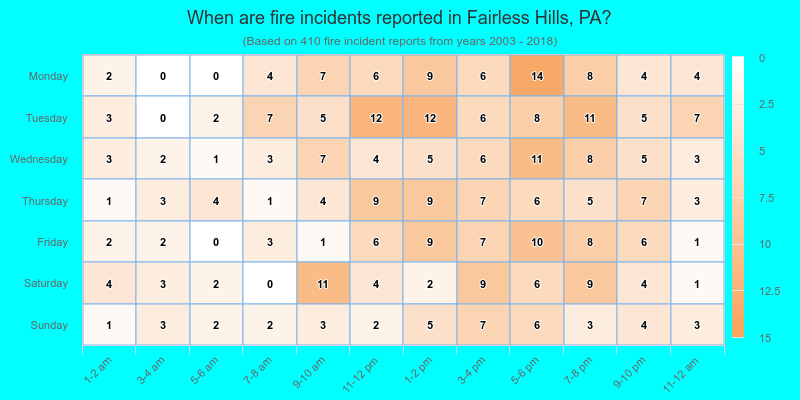
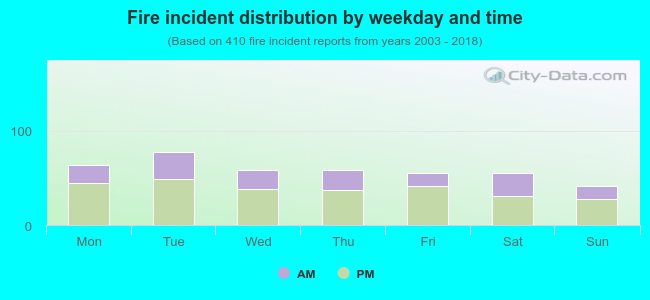 34.4% incidents where reported in the morning and 65.6% in the evening. The most fires (19.0%) took place on Tuesday, and the least (10.0%) on Sunday.
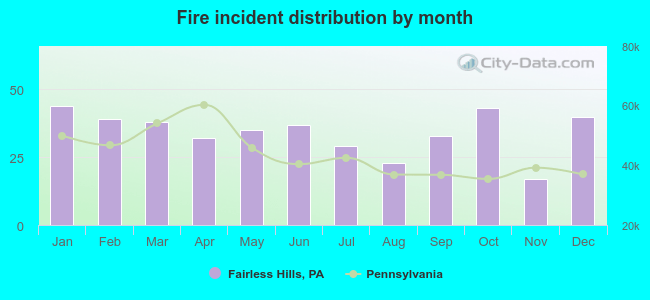 According to the 410 fire incidents from years 2003 - 2018 most fires (10.7%) took place during January, and the least (4.1%) in November.
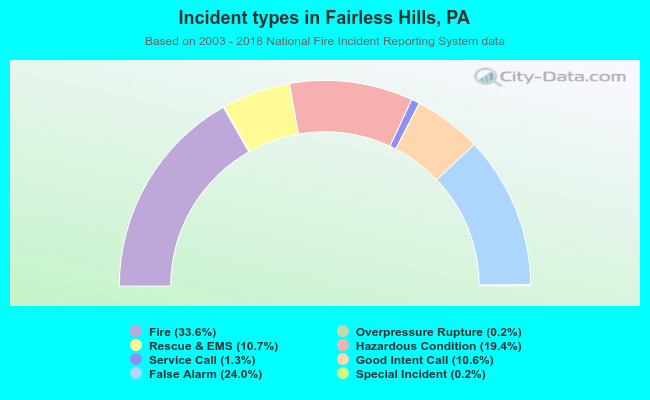 Out of all 1,221 cases reported during the years 2003 - 2018, the most belonged to the categories: Fire (33.6%), False Alarm (24.0%), and Hazardous Condition (19.4%).
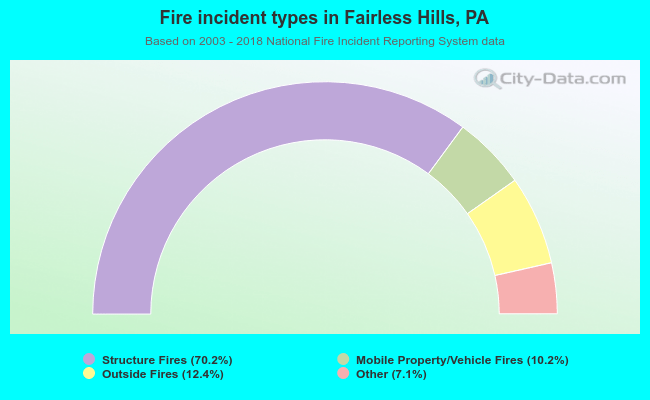 When looking into fire subcategories, the most reports belonged to: Structure Fires (70.2%), and Outside Fires (12.4%).