| Fire incidents reported |
|---|
| Sreet name | Count |
|---|
| ACADEMY ST | 34 | | MAIN ST | 30 | | INTERSTATE 195 | 28 | | ASBURY RD | 14 | | MUTUAL AID - 19-4 | 12 | | RAILROAD AVE | 12 | | RUSET LN | 12 | | BIRDSALL RD | 10 | | WEST MAIN ST | 10 | | YELLOWBROOK RD | 10 | | 33 HWY | 8 | | 547 RT | 8 | | HERBERTSVILLE RD | 8 | | PREVENTORIUM RD | 8 | | STATE HIGHWAY 33 | 8 | | 33 RT | 6 | | BANK ST | 6 | | BELMAR BLVD | 6 | | BOUD AVE | 6 | | MAIN ST | 6 | | MUTUAL AID | 6 | | MUTUAL AID - 19-2 | 6 | | OLD TAVERN RD | 6 | | RT 524ASQUMKUMYLLWBK | 6 | | SOUTHARD AVE | 6 |
| | | Fire incidents reported |
|---|
| Sreet name | Count |
|---|
| SQUANKUM - YELLOW BROOK RDS | 6 | | SQUANKUM YELLOWBROOK RD | 6 | | 524A RT | 4 | | ACADEMY ST | 4 | | ACADEMY ST. | 4 | | ALLAIRE ROAD | 4 | | ATLANTIC AVE | 4 | | BELMAR BOULEVARD | 4 | | BOUD AVE | 4 | | CHESTNUT ST | 4 | | CRANBERRY RD | 4 | | EMMONS AVE | 4 | | MANASSA RD | 4 | | MUTUAL AID - 19-5 | 4 | | NORTH MAIN ST | 4 | | RAMTOWN-GREENVILLE RD | 4 | | RT 33 | 4 | | RT 547SQUANKUM RD | 4 | | RUSSET LN | 4 | | SQUANKUM ROAD / 547 RT | 4 | | SQUANKUM ROAD / COUNTY HIGHWAY | 4 | | SQUANKUM ROAD COUNTY HIGHWAY | 4 | | SQUANKUM YELLOWBROOK 524A RD | 4 | | SQUANKUM YELLOWBROOK ROAD | 4 | | |
|
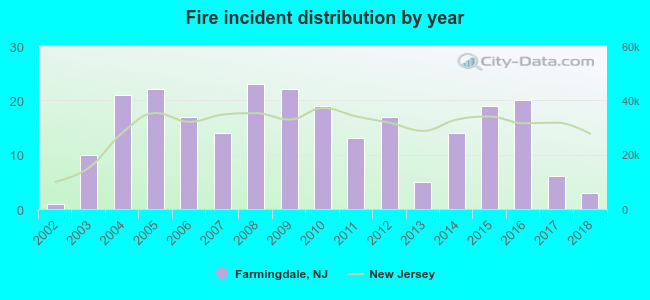 Based on the data from the years 2002 - 2018 the average number of fire incidents per year is 14. The highest number of fires - 23 took place in 2008, and the least - 1 in 2002. The data has a rising trend.
 31.3% incidents where reported in the morning and 68.7% in the evening. The most fires (18.3%) took place on Thursday, and the least (6.9%) on Tuesday.
 Based on the 246 incident reports from years 2002 - 2018 most fires (12.2%) took place during March, and the least (5.7%) in February.
 Out of all 1,323 cases reported during the years 2002 - 2018, the most belonged to the categories: Rescue & EMS (30.9%), Good Intent Call (20.0%), and Fire (18.6%).
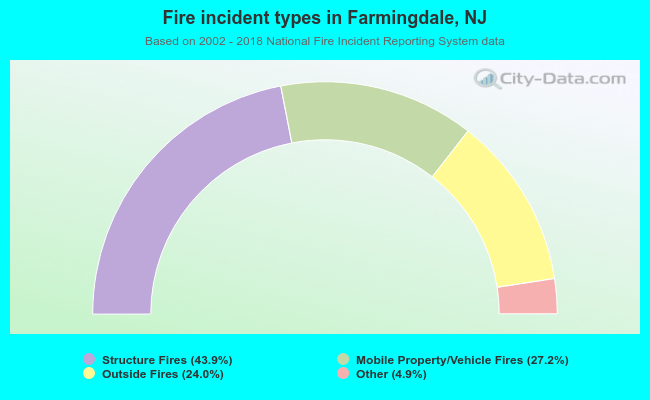 When looking into fire subcategories, the most reports belonged to: Structure Fires (43.9%), and Mobile Property/Vehicle Fires (27.2%).